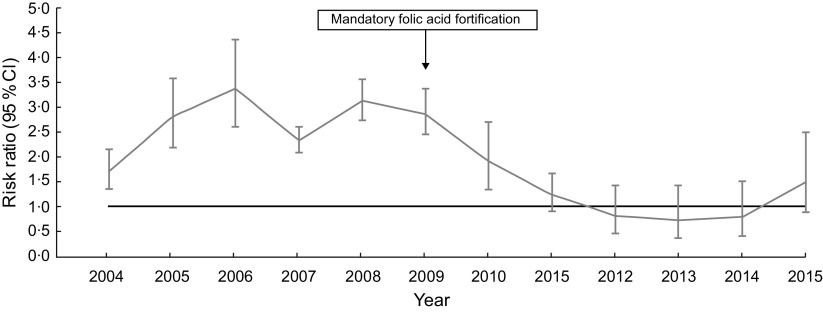
Fig. 3.
Unadjusted risk ratios, with 95 % CI represented by vertical bars, for the association between folic acid deficiency and Indigenous status, from 1 January 2004 to 31 December 2015 (n 291 908), Queensland, Australia:  , risk ratio between the prevalence of folic acid deficiency in Indigenous v. non-Indigenous persons;
  , reference line included to illustrate a risk ratio of 1 (identical risk in both groups)

