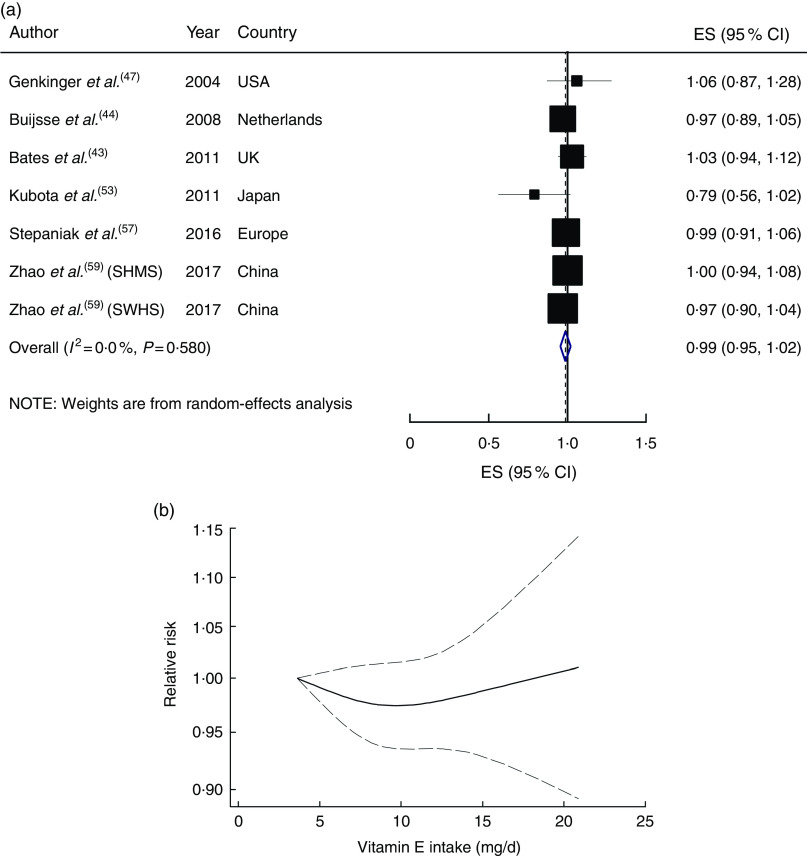
Fig. 3.
(a) Forest plot showing relative risk of cardiovascular mortality for a 5 mg/d increment in vitamin E intake. The study-specific effect size (ES) and 95 % CI are represented by the black square and horizontal line, respectively; the area of the black square is proportional to the specific-study weight to the overall meta-analysis. The centre of the blue open diamond and the vertical dashed line represent the pooled ES, and the width of the blue open diamond represents the pooled 95 % CI (SMHS, Shanghai Men’s Health Study; SWHS, Shanghai Women’s Health Study). (b) Dose–response association of vitamin E intake and risk of total cardiovascular mortality (———), with 95 % CI (— — —)

