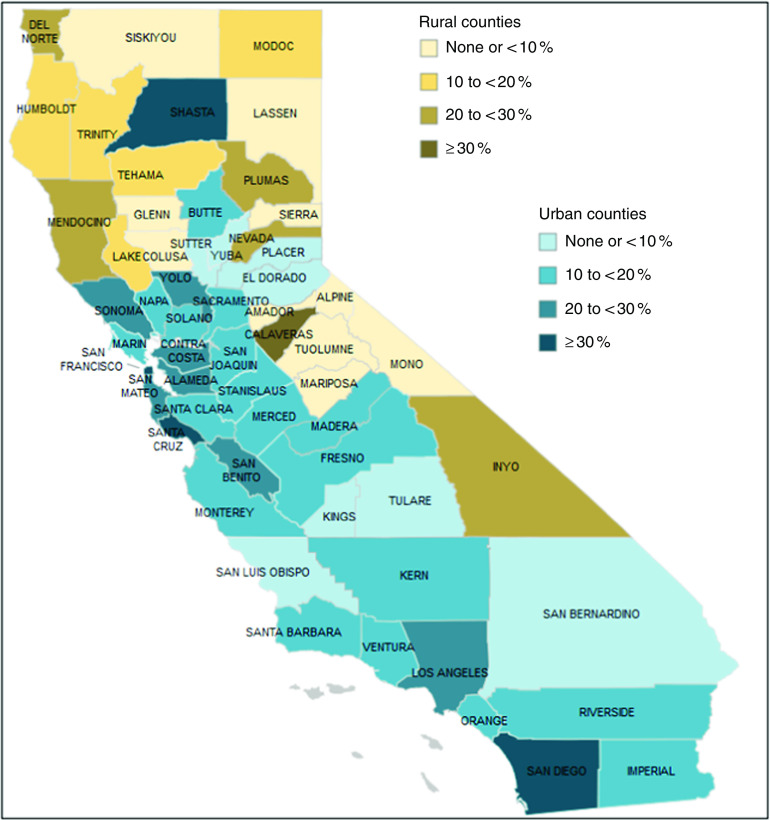
Fig. 1.
Map of summer meal uptake rates by county, California, USA, July 2016. Uptake rates are calculated as percentages, based on number of summer lunches served daily per county through the Summer Food Service Program, Seamless Summer Option or National School Lunch Program (NSLP) in July 2016, divided by number of meals served daily at free/reduced price through NSLP in October 2015

