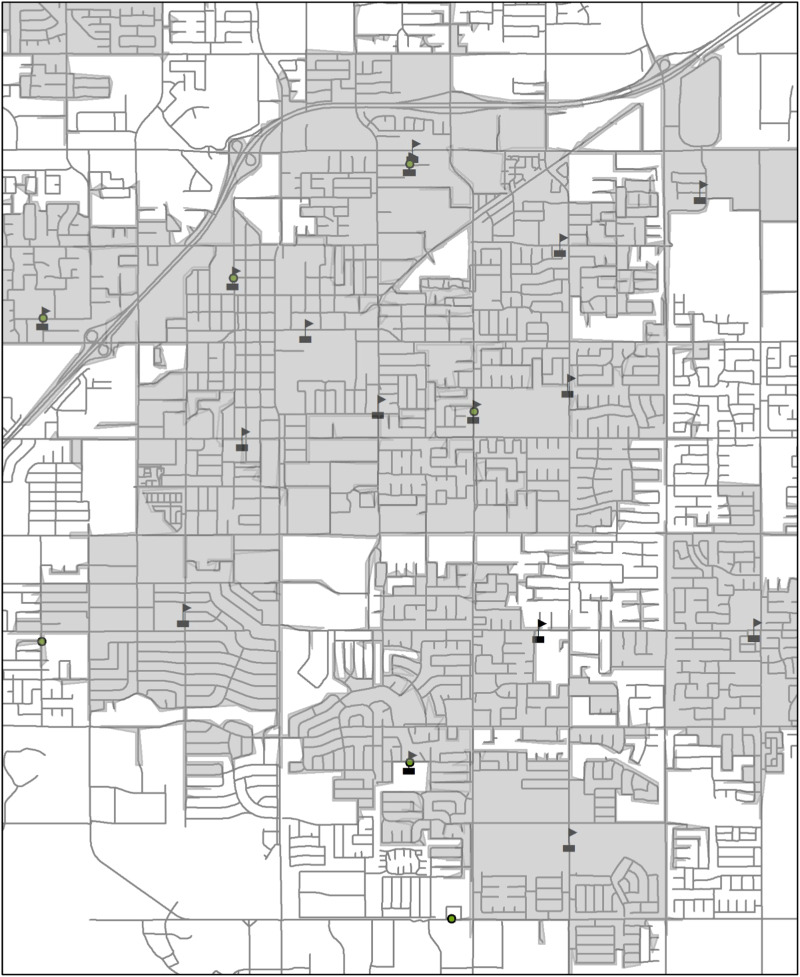
Fig. 2.
(colour online) Illustration of urban schools with 1·6 km (1 mile) service areas, California, USA, summer 2016. Circle indicates a summer nutrition programme site; flag indicates a school building and is the centre of each service area. Grey areas are the service areas around each school and white areas are outside the service area

