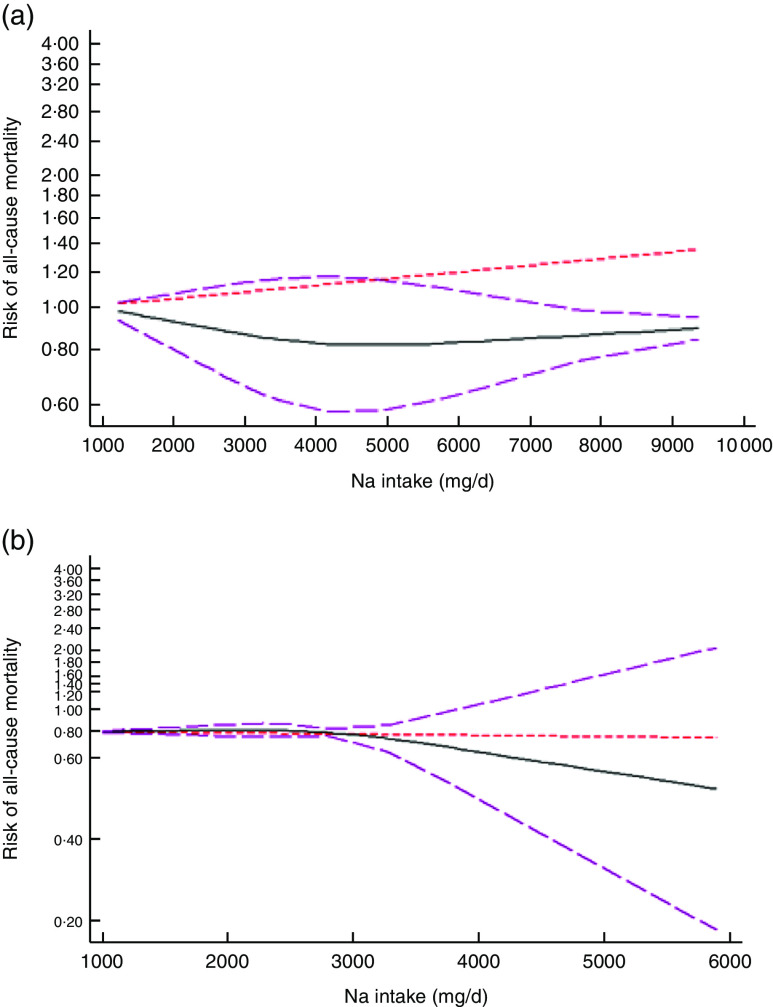
Fig. 3.
(colour online) The non-linear association meta-analysis between adjusted hazard ratios of all-cause mortality and sodium intake among studies using (a) dietary intake assessment and (b) urinary sodium excretion. Sodium intake was modelled with restricted cubic splines in a multivariate random-effects dose–response model ( , linear model;
  , spline model;
  , 95% CI); the vertical axis is on a log scale

