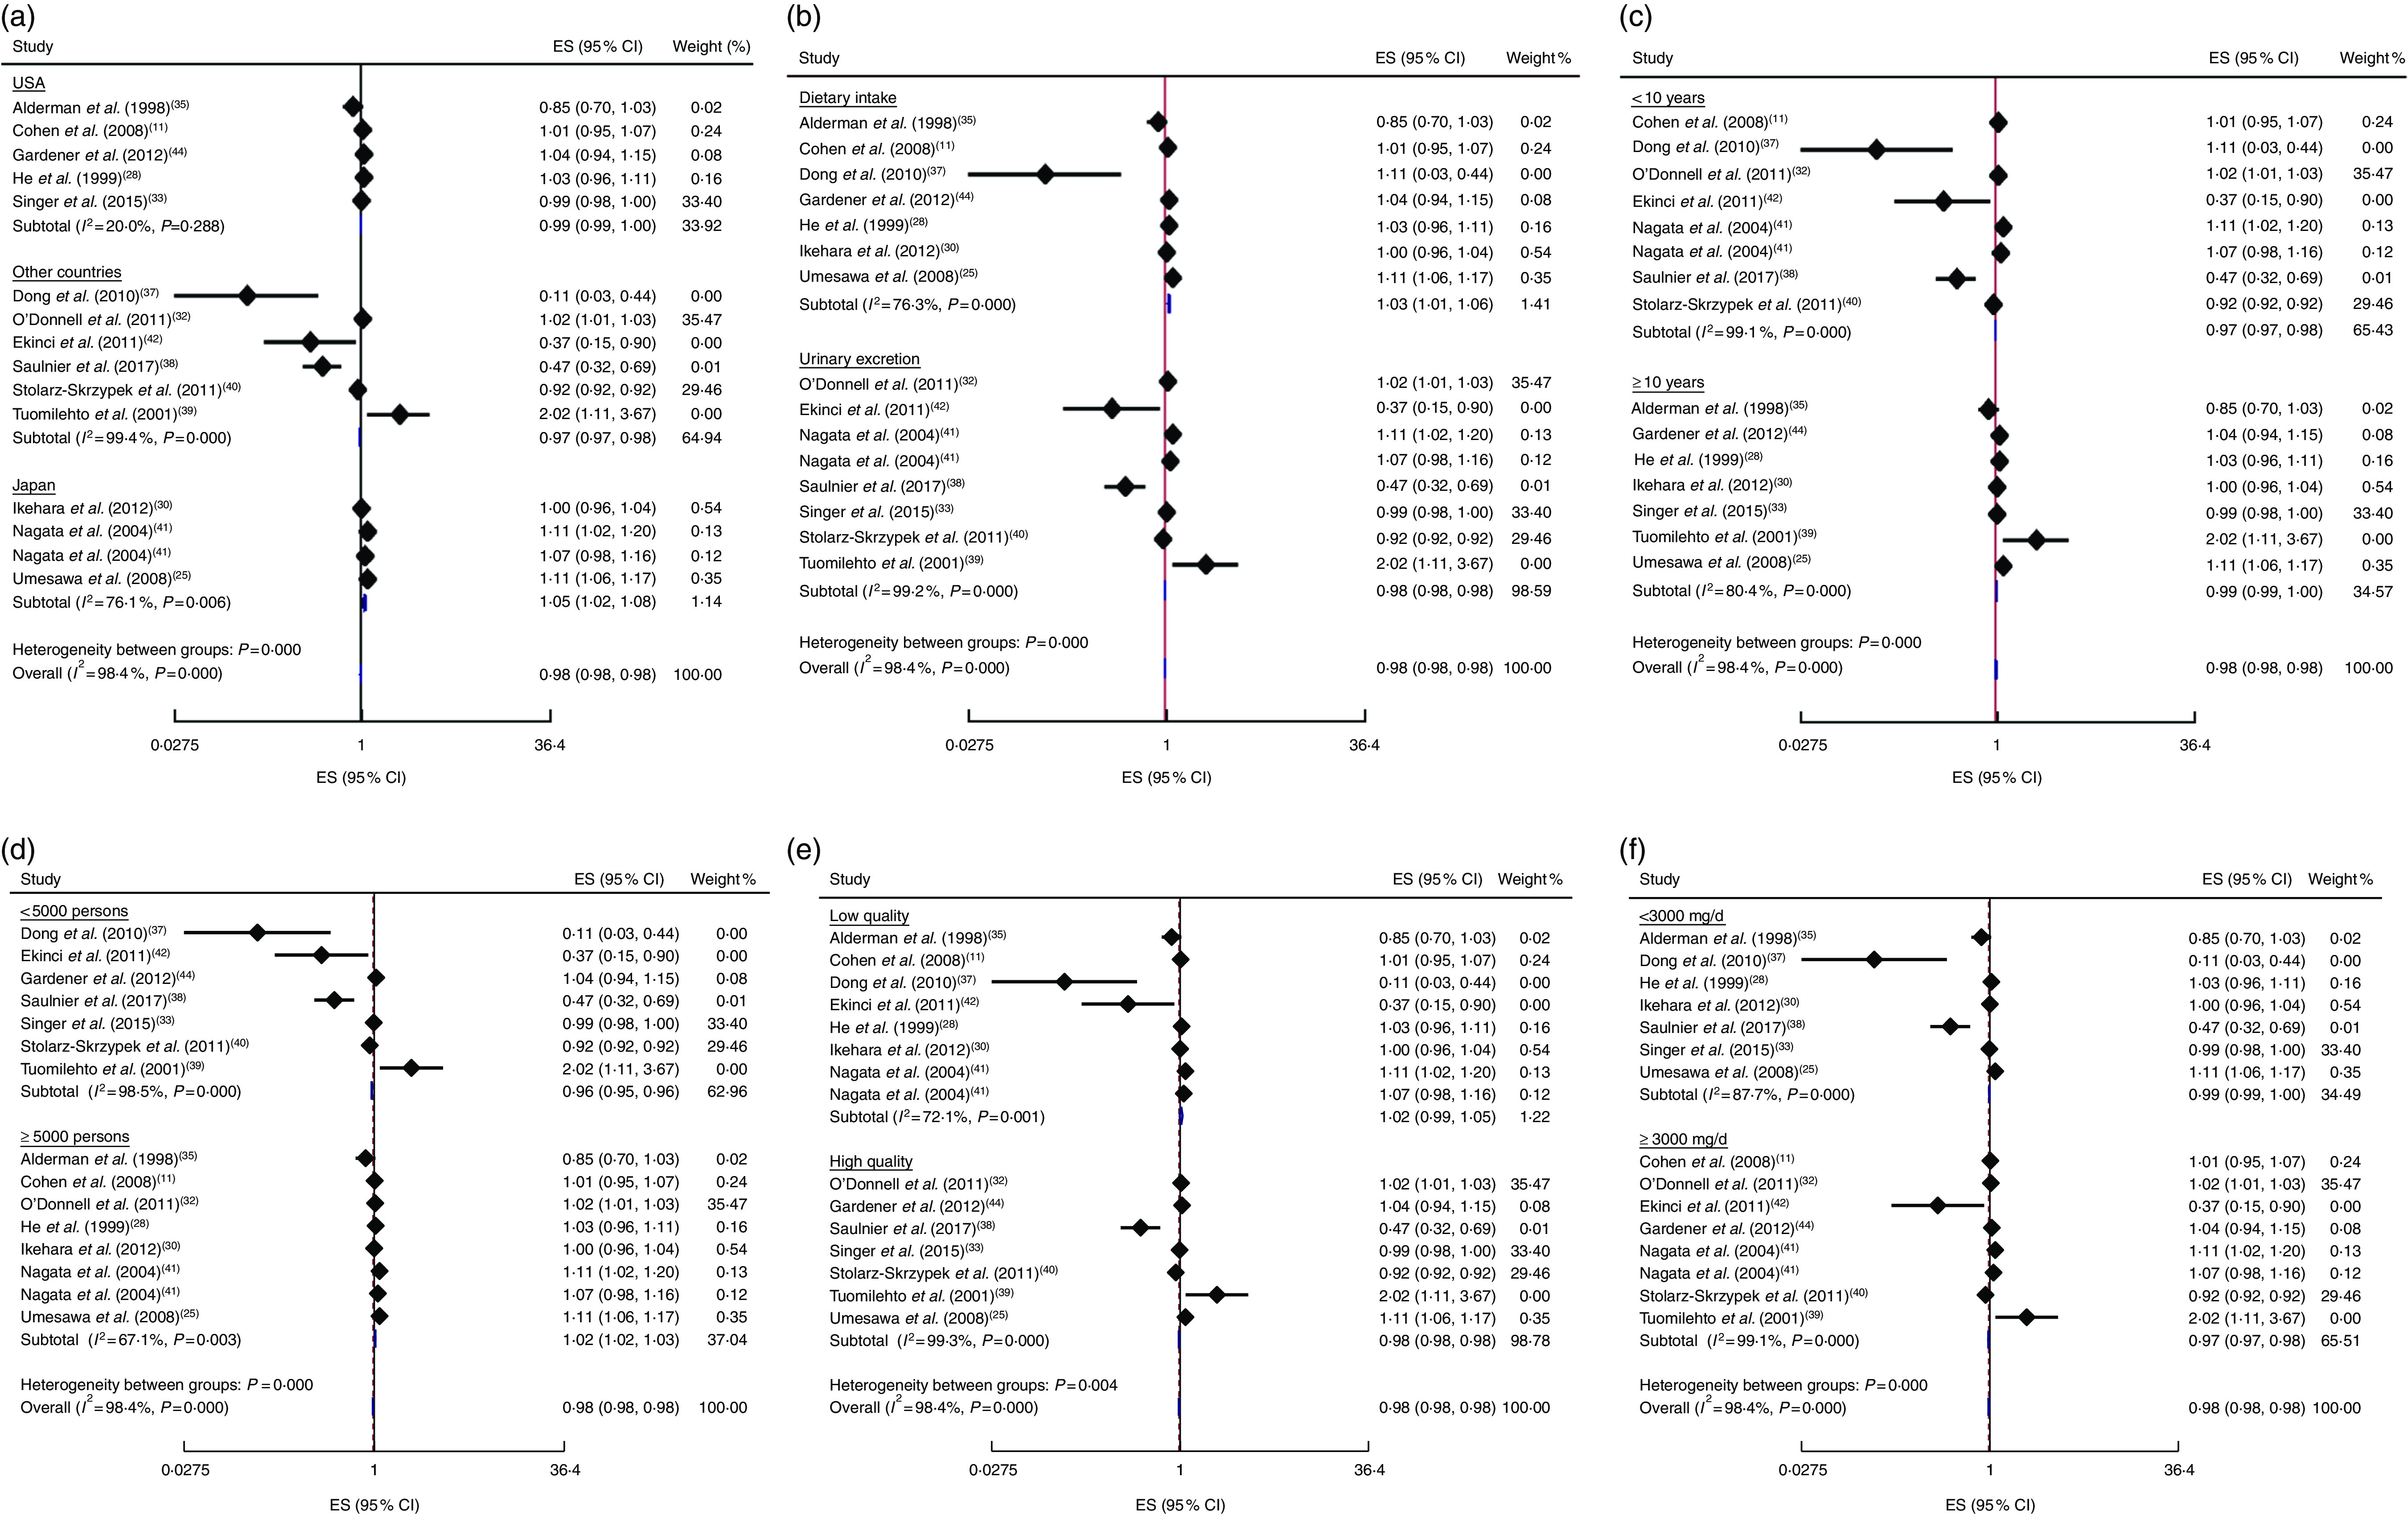
Fig. 7.

(colour online) Forest plots for subgroup analysis of the linear trend meta-analysis between 100mg/d increment in sodium intake and CVD mortality by (a) country, (b) exposure assessment, (c) follow-up duration, (d) study sample size, (e) study quality and (f) daily sodium intake. The effect size (ES) and 95% CI are represented by the black diamond and horizontal line, respectively; the study weight is proportional to the inverse of the variance of the ES. The centre of the blue open diamond and the vertical dashed red line represent the pooled ES, the width of the open diamond represents the pooled 95% CI and the vertical black line at ES=1 represents the null effect
