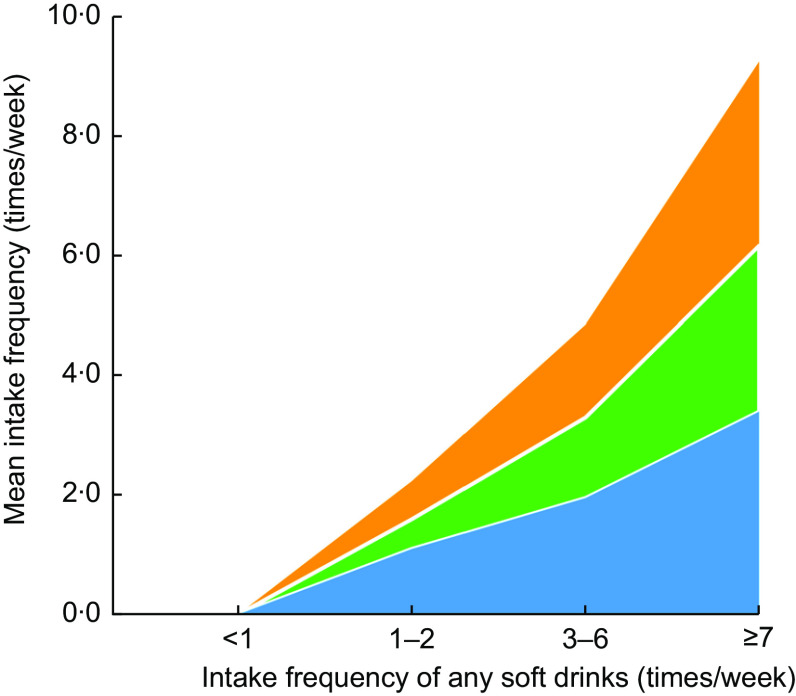
Fig. 1.
Cumulative area map for the mean intake frequencies of the three soft drinks ( , soda;
  , sweetened tea drink;
  , fruit-flavoured drink) across the intake frequency groups of any soft drinks in the sample of students (n 8085) newly enrolled in a comprehensive university in Changsha, China, 2017

