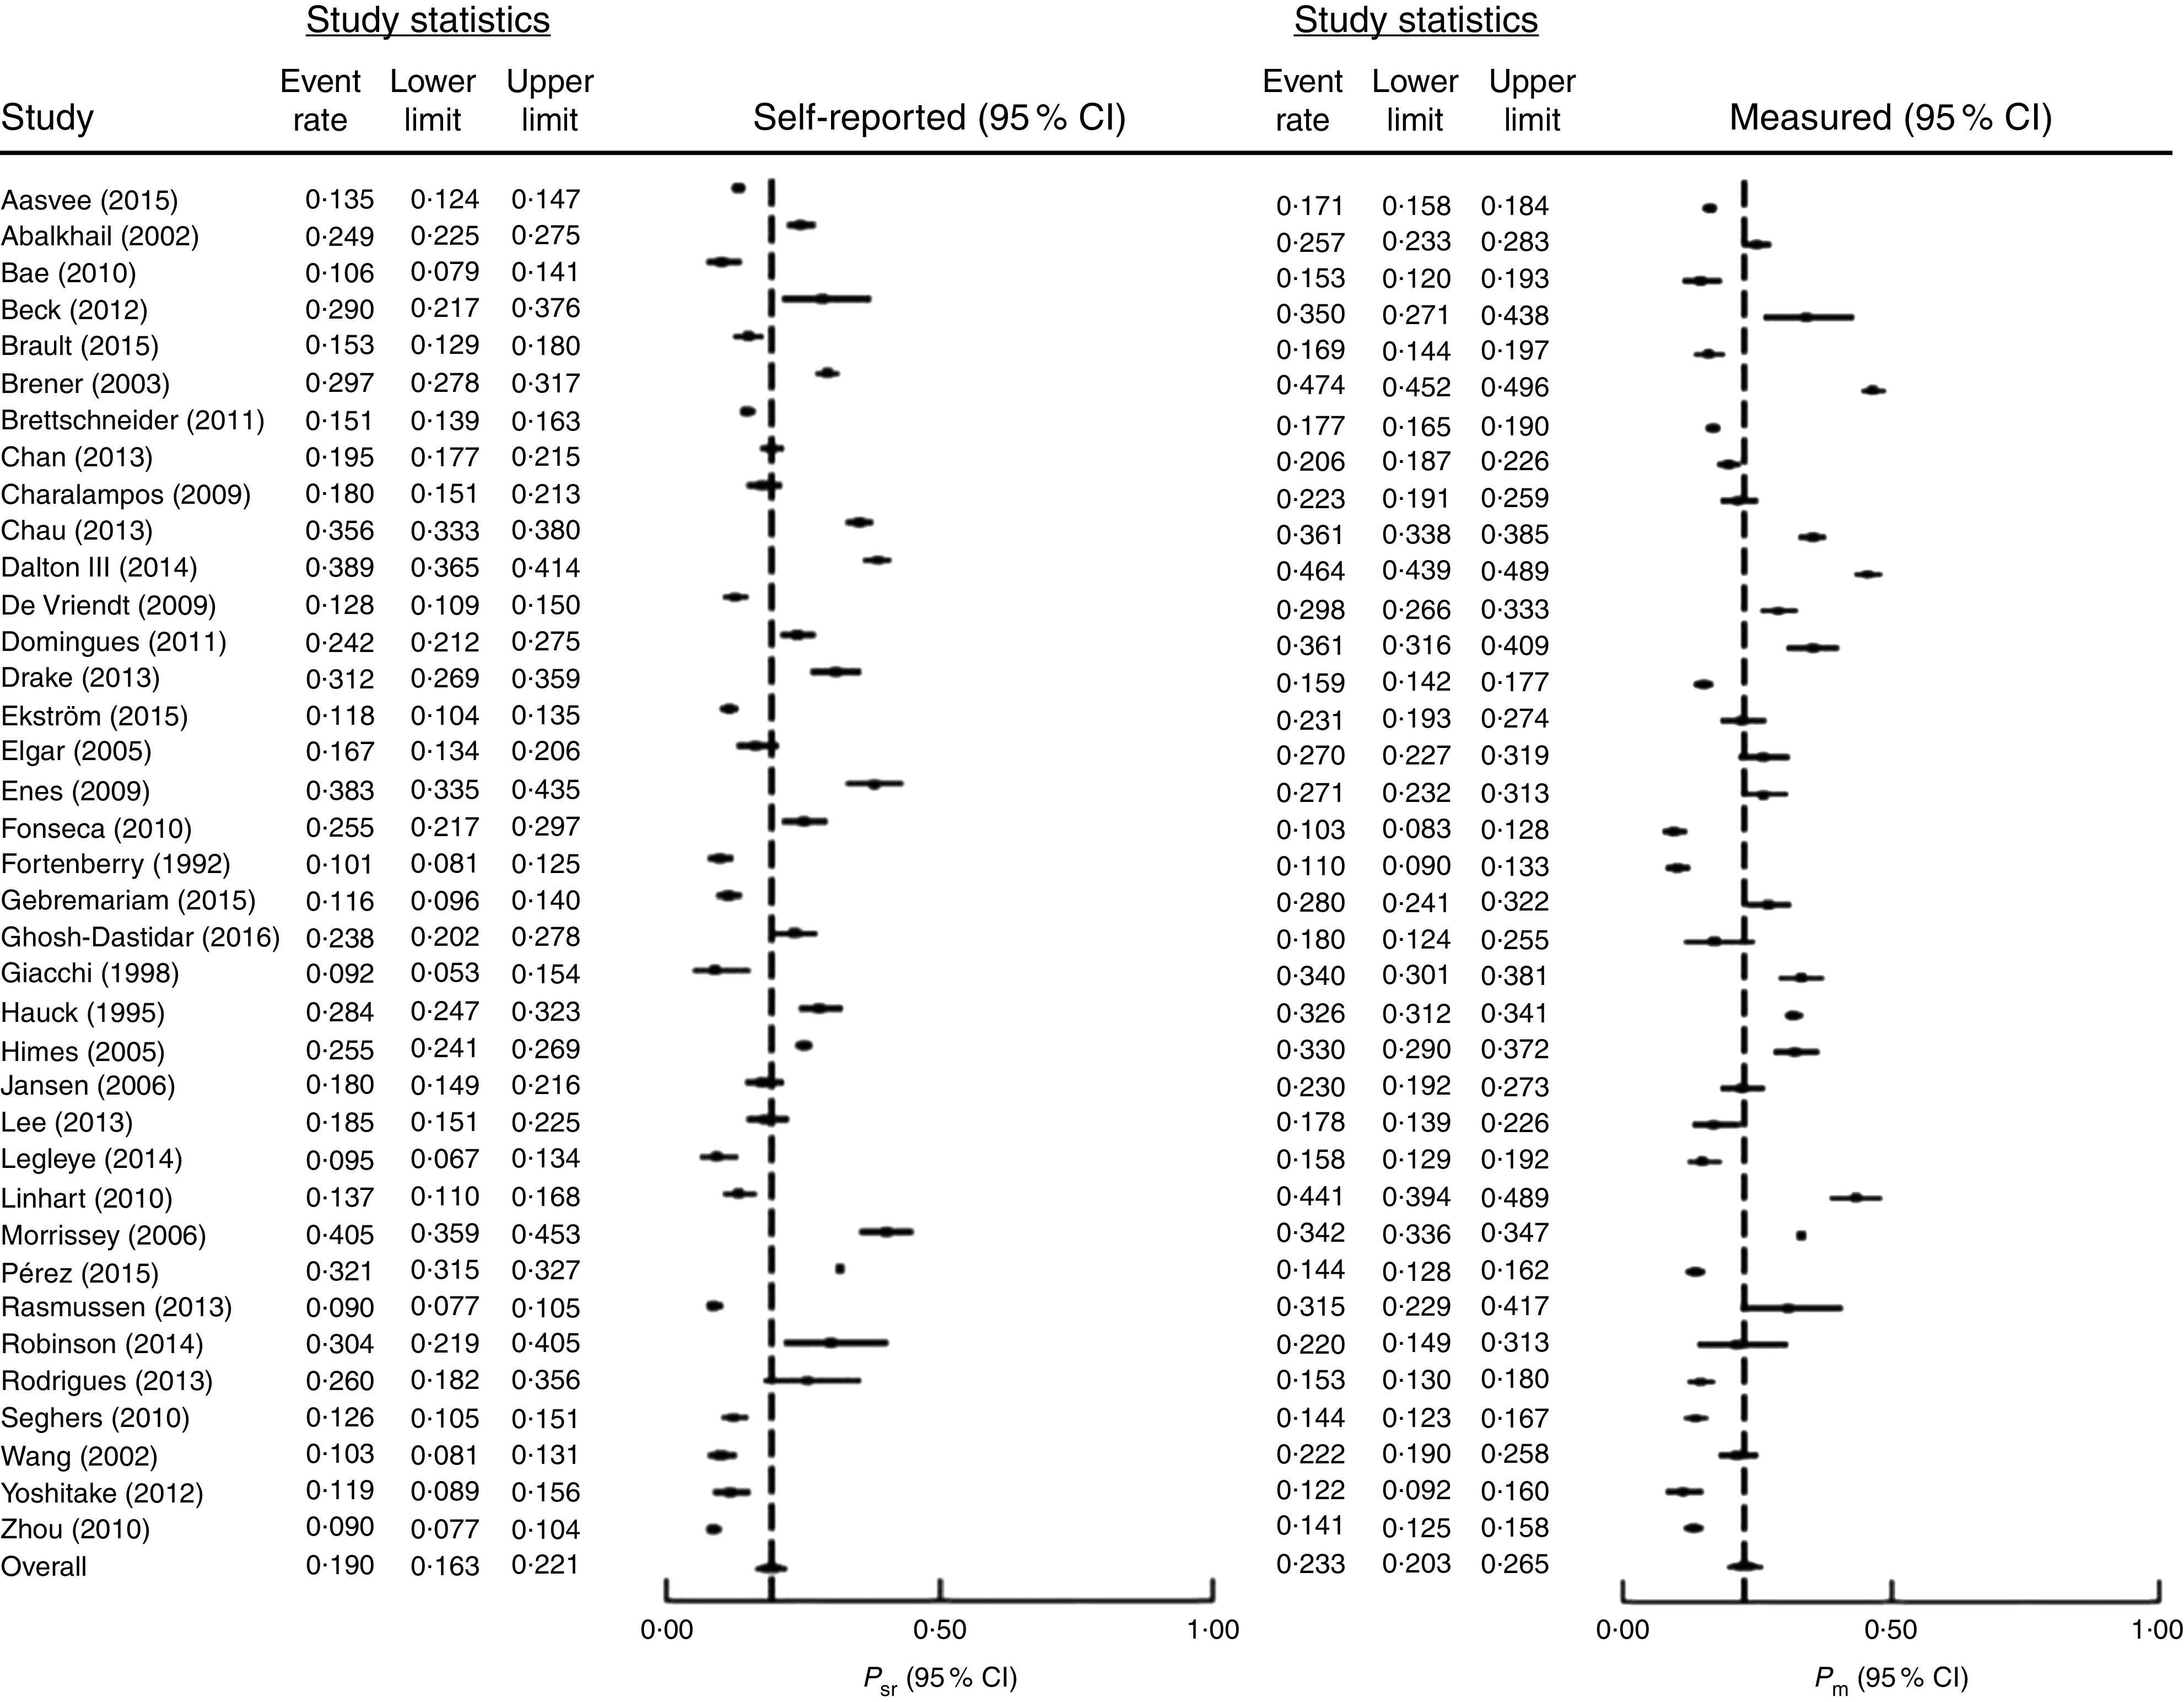
Fig. 2.

Forest plots for the prevalence rates of overweight and obesity in children and adolescents based on BMIsr (left) and BMIm (right). The study-specific prevalence rate and 95 % CI are represented by the black square and horizontal line, respectively; the centre of the diamond represents the pooled prevalence rate and its width represents the pooled 95 % CI (BMIsr, BMI derived from self-reported height and weight; BMIm, BMI derived from measured height and weight; P sr, prevalence rate based on BMIsr; P m, prevalence rate based on BMIm)
