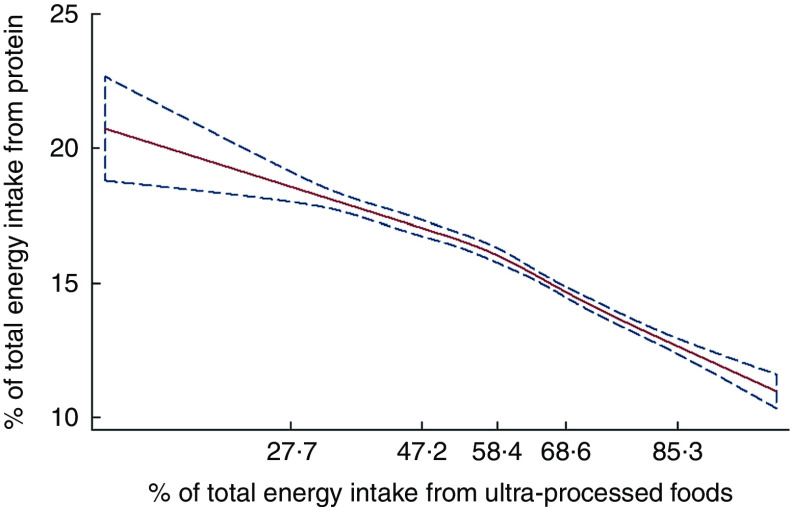
Fig. 1.
Regression of dietary protein content v. the dietary contribution of ultra-processed foods evaluated by restricted cubic splines ( , predicted values;
  , 95 % CI), among the US population aged ≥2 years (n 9042), National Health and Nutrition Examination Survey 2009–2010. The values shown on the x-axis correspond to the 5th, 27·5th, 50th, 72·5th and 95th percentiles for percentage of total energy from ultra-processed foods (knots). Coefficient for linear term=−0·08 (95 % CI −0·13, −0·03). There was little evidence of non-linearity in the restricted cubic spline model (Wald test for linear term P=0·006; Wald test for all non-linear terms P=0·07)

