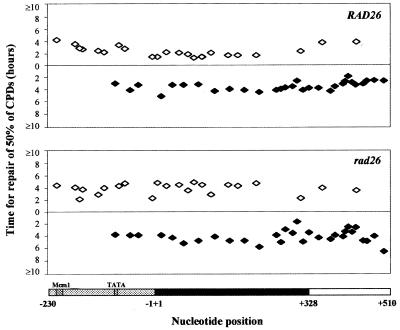
Figure 3.
CPD repair in RAD26 and rad26 cells. The autoradiographs were quantified with ImageQuant software (Molecular Dynamics). The time for repair of 50% of CPDs (t50%) at a given site was calculated or extrapolated. The t50% for slowly or unrepaired CPDs (t50% ≥ 10 h) is shown at the same level on the graph. Open diamonds, CPDs in the TS; closed diamonds, CPDs in the NTS. The horizontal bars at the bottom show the different regions of the RsaI fragment containing the MFA2 gene, and are as in Figure 1. Numbers beneath the bars denote the nucleotide position in relation to MFA2.

