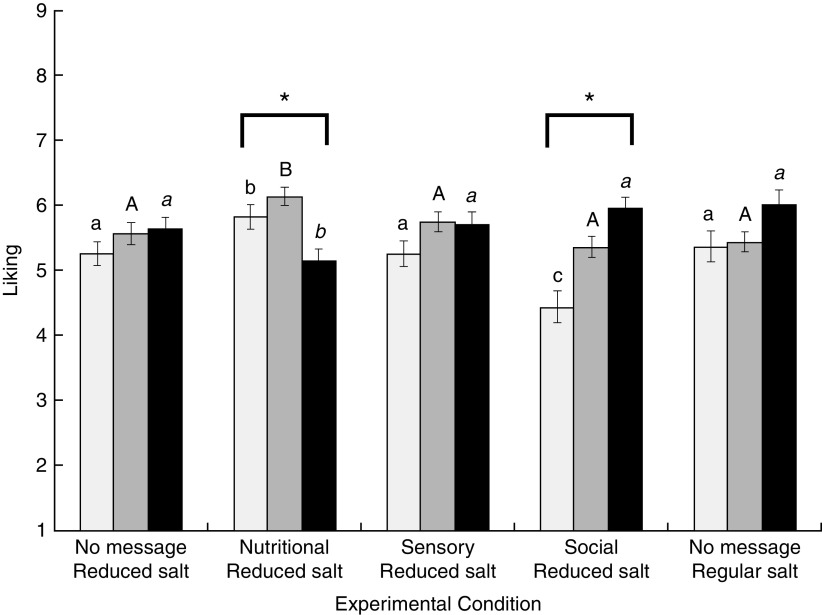
Fig. 2.
Mean liking scores of the soups (with their standard errors represented by vertical bars) per experimental condition for the ‘not aware, no action’ ( ), ‘aware, no action’ (
 ) and ‘aware and action’ (
 ) Interest in Salt Reduction groups, measured on a 9-point scale (from 1=‘not liked at all’ to 9=‘liked very much’), among British consumers (n 493) aged 24–65 years, November–December 2013. *Mean values were significantly different between the three Interest in Salt Reduction groups for the same soup. a,b,cMean values for products with unlike superscript lower-case letters were significantly different within the ‘not aware, no action’ group across the soups (P<0·05). A,BMean values for products with unlike superscript upper-case letters were significantly different within the ‘aware, no action’ group across the soups (P<0·05).
a,b
Mean values for products with unlike superscript lower-case italic letters were significantly different within the ‘aware and action’ group across the soups (P<0·05)

