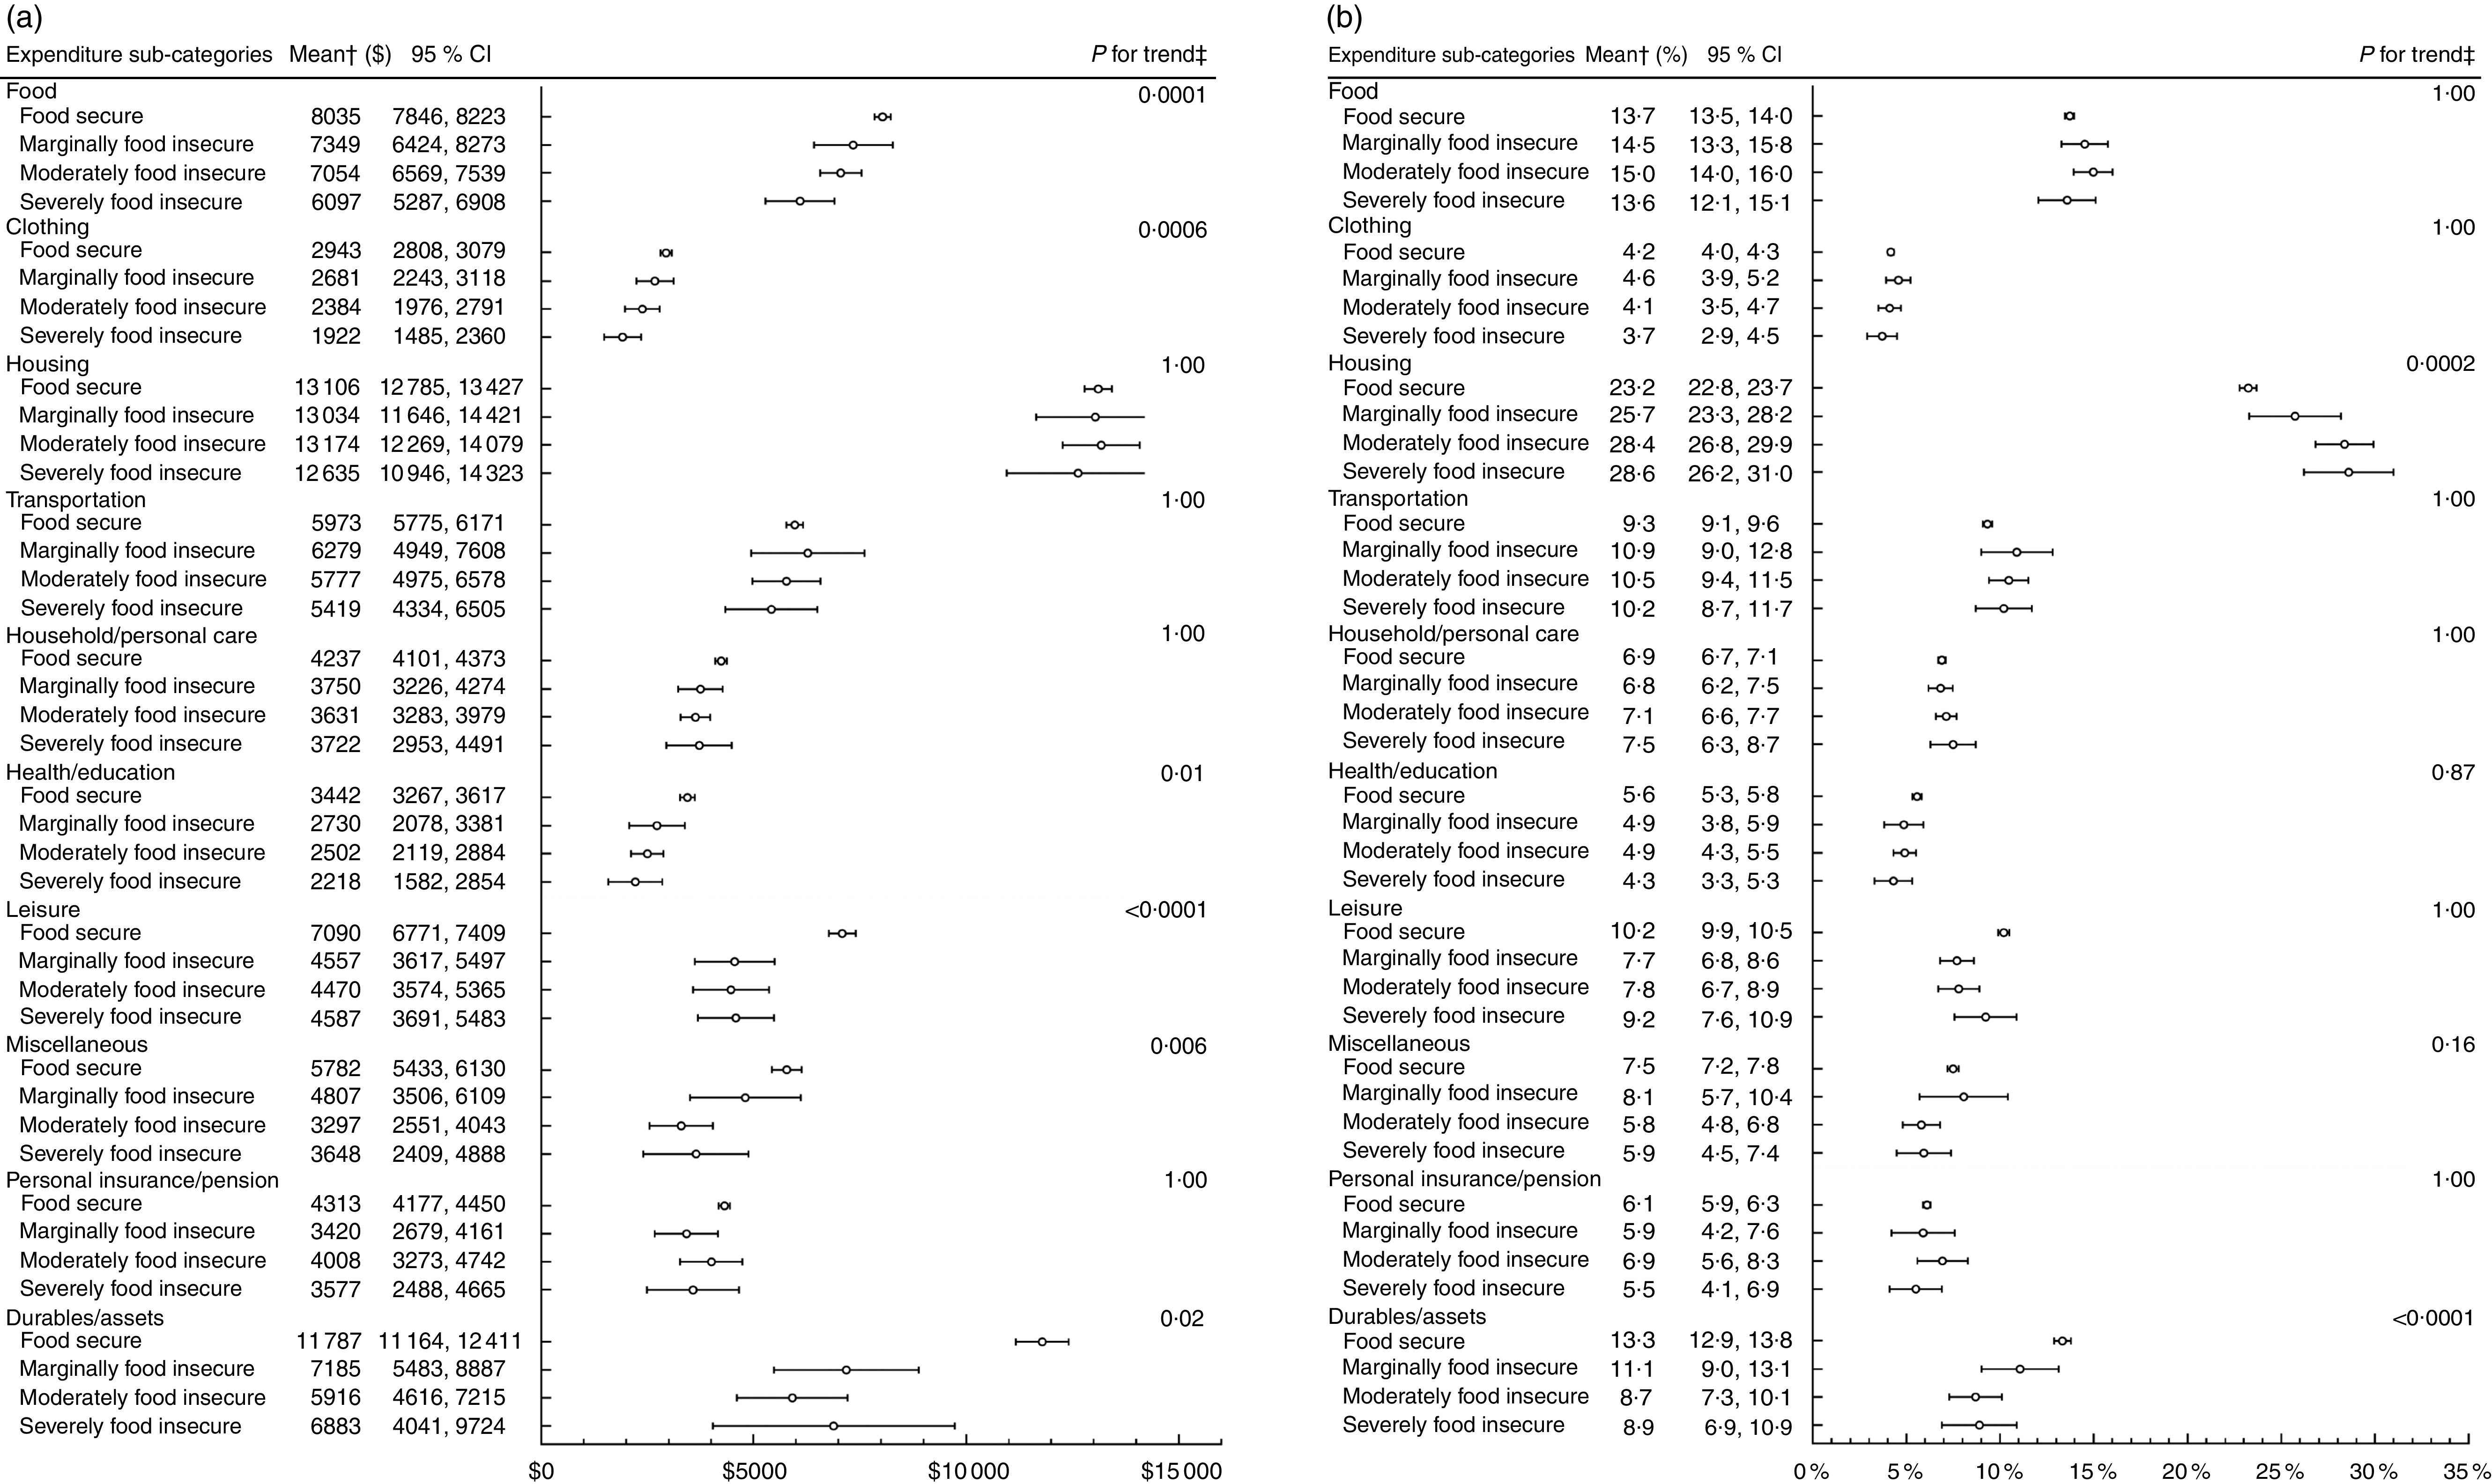
Fig. 4.

Mean dollars spent in each expenditure sub-category by household food insecurity status* while controlling for household income (a) and mean budget share allocated to each expenditure sub-category by household food insecurity status* while controlling for household income (b) in a population-based sample of households from the ten provinces of Canada (n 9050), 2010 Survey of Household Spending. All dollar values are $CAN. *Analyses using all households with no missing food insecurity status; food secure (n 7783), marginally food insecure (n 324), moderately food insecure (n 621) and severely food insecure (n 322). †Predicted means conditional on number of children <18 years, number of adults 18–64 years and number of seniors ≥65 years in the household, and quartiles of after-tax household income set at observed values; means (○) and 95 % CI (represented by horizontal bars) estimated while accounting for the complex survey design. ‡Bonferroni-adjusted P value for linear trend test across household food insecurity status; the linear trend test accounted for the complex survey design
