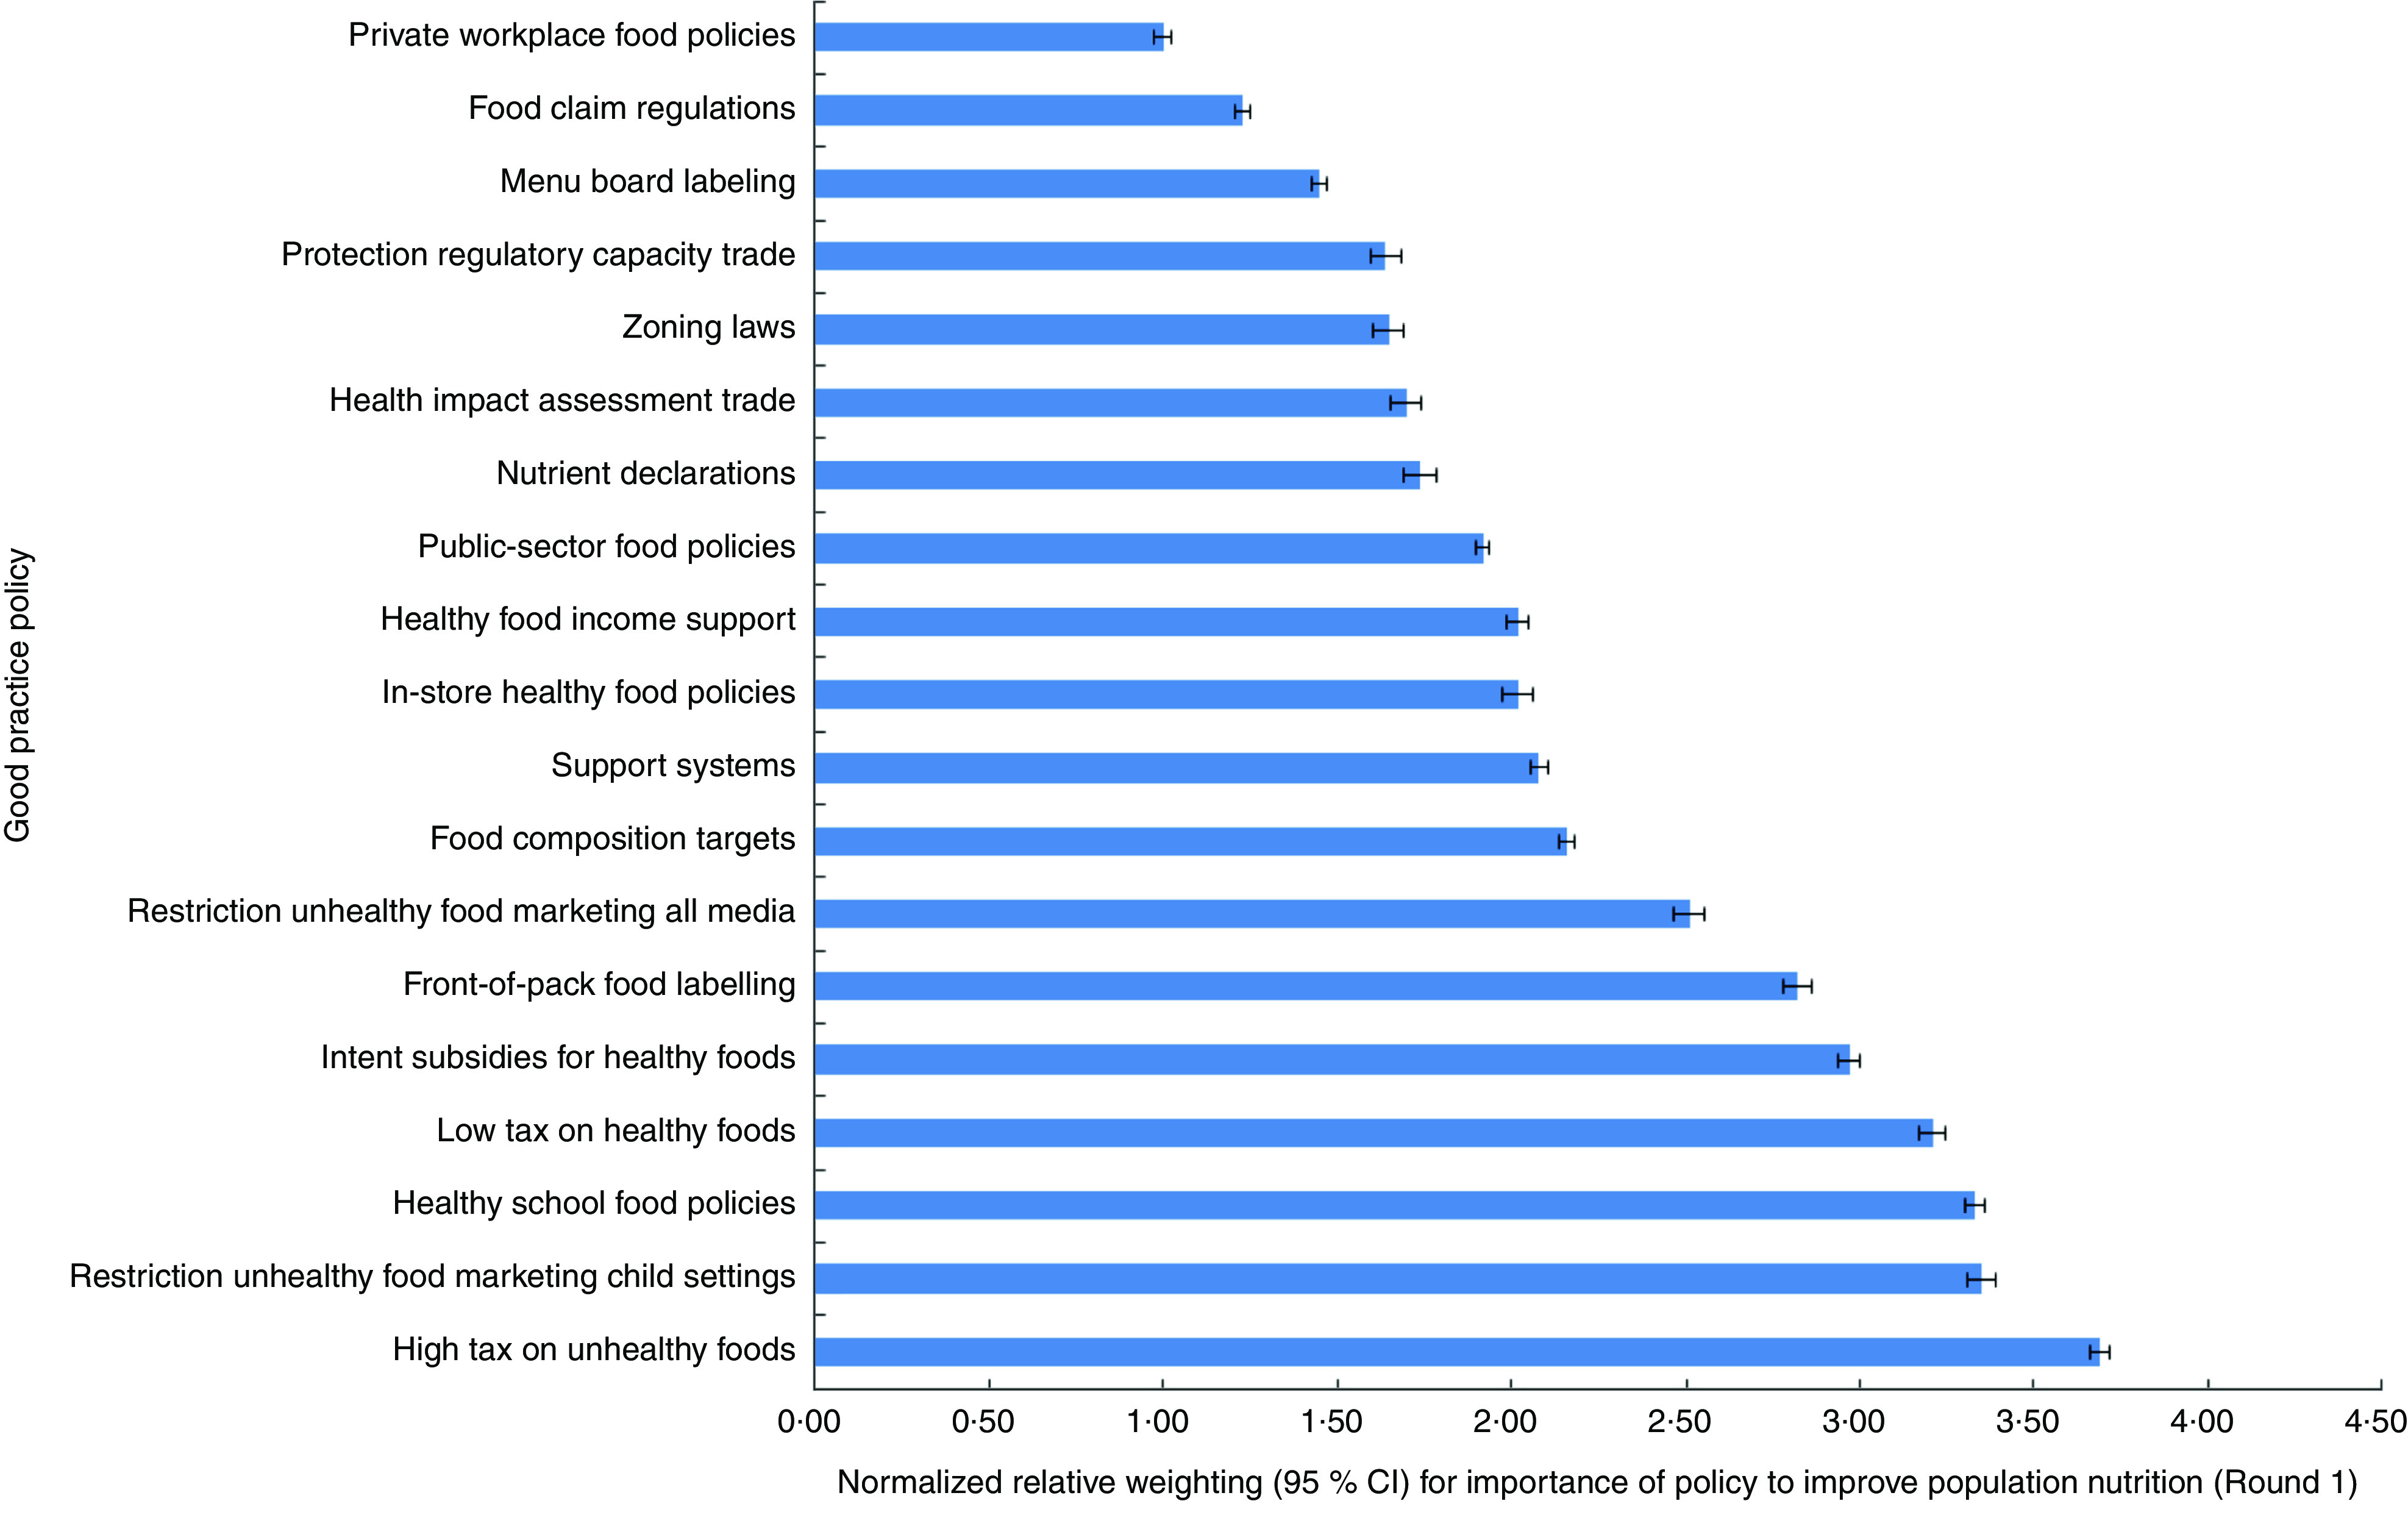
Fig. 1.

(colour online) Bar chart showing the normalized relative weightings (with 95 % CI represented by horizontal bars) for each of the good practice policies to improve population nutrition derived from Round 1 of the Delphi process performed with international food policy experts (n 27) in 2015
