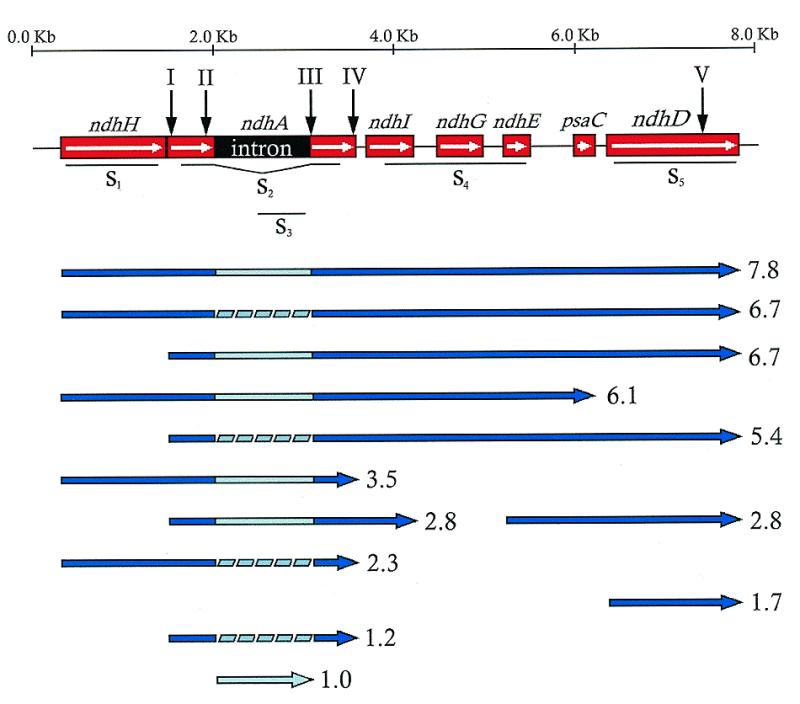
Figure 2.

Gene and transcript maps of the ndhH–D operon of barley. Gene map of the 8125 bp sequenced DNA region of barley (up) shows with roman numbers on vertical arrows the location of the edited sites. Probes used in northern assays are represented under the gene map. The map of transcripts (down) was deduced from northern assays and RT–PCR amplifications and sequencing with specific primer pairs. The estimated sizes are indicated (kb) at the right of each transcript.
