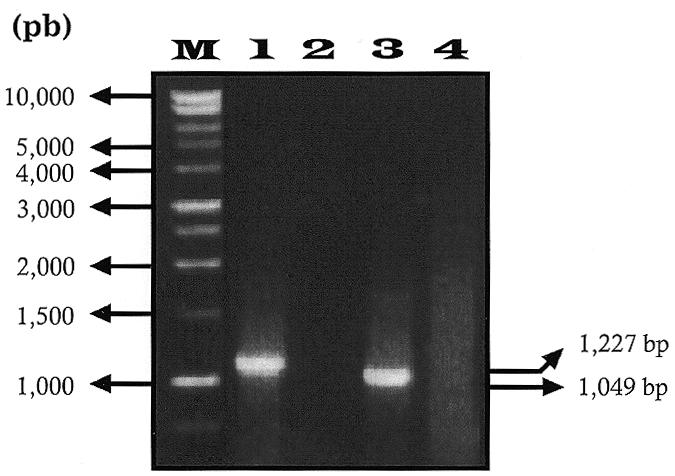
Figure 3.

Agarose gel electrophoresis of RT–PCR amplification products with and without sequences of the ndhA intron. RNA isolated from gel section 1 (Fig. 1) was RT–PCR amplified with primer pairs P21 (bases 798–819 of the ndhA intron) and P30 (bases 331–352 of ndhI) (lane 1) and P16 (bases 490–515 of the first exon of ndhA) and P30 (lane 3). Lanes 2 and 4 are RT–PCR controls without eluted RNA of lanes 1 and 3, respectively. Lane M contains size markers (bp) indicated at the left. Sizes (bp) of amplified bands are indicated at the right.
