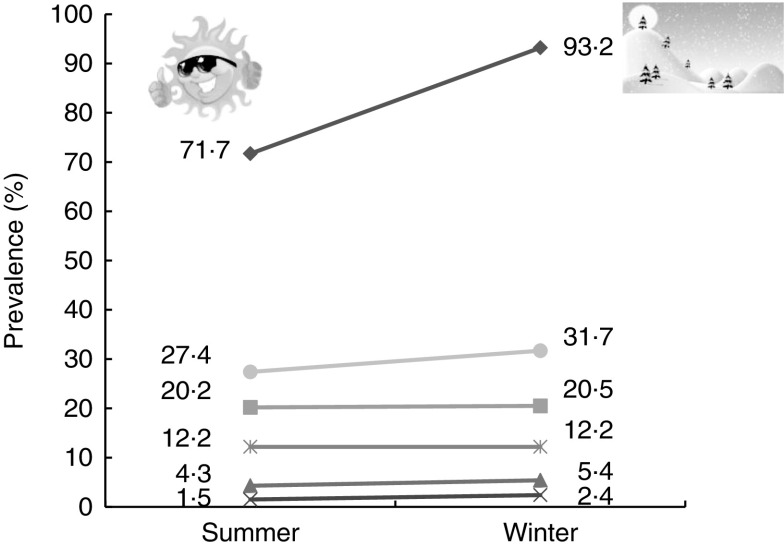
Fig. 2.
The annual trend of change in undesirable vitamin D status and cardiometabolic risk factors ( , poor vitamin D status;
  , high BMI;
  , high TAG;
  , high total cholesterol;
  , high LDL cholesterol;
  , low HDL cholesterol) among 530 apparently healthy children aged 5–18 years from six Iranian provinces with a latitudinal gradient from 29°N to 37·5°N (summer, August–September; winter, February–March)

