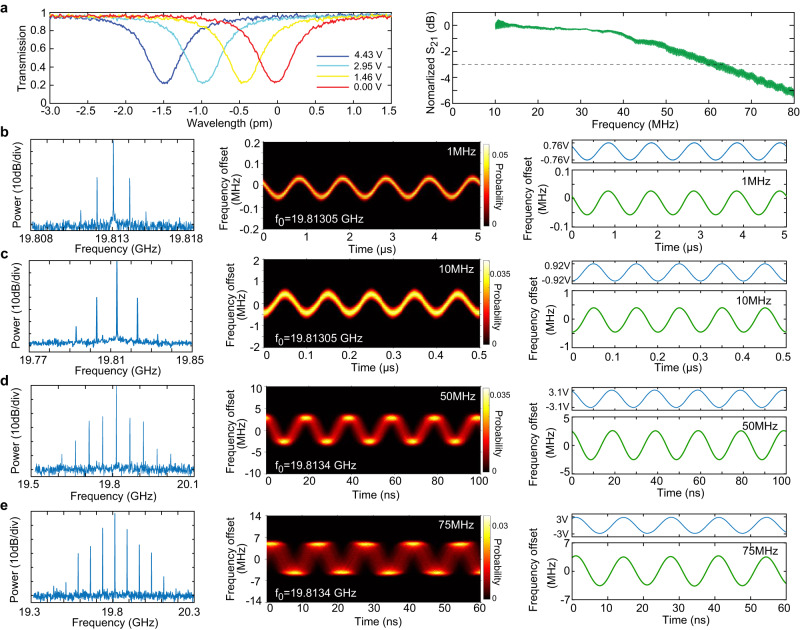
Fig. 3. High-speed modulation of the soliton microcombs.
a Electro-optic tuning performance of the comb resonator. Left: DC tuning of a cavity resonance. Right: Electro-optic modulation response S21 of the comb resonator. To characterize the EO tuning performance, the pump laser power was reduced to a low level such that no comb or other nonlinear effect was produced, and the device functioned essentially as a pure electro-optic modulator. To obtain the S21 curve, the pump laser wavelength is fixed to a cavity resonance, and the modulation amplitude of resonator transmission was recorded as a function of the modulation frequency with a network analyzer. b–e Frequency modulation of the soliton comb repetition rate at a modulation frequency of 1 (b), 10 (c), 50 (d), and 75 MHz (e), respectively. Left column: spectrum of the detected microwave. Center column: frequency vs. time spectrum. Right column: top: applied driving voltage; bottom: time-dependent frequency curve, which is the averaged trace of the frequency vs time spectrum shown in the center column. The data were recorded with an electrical spectrum analyzer (Tektronics, RSA5126B). In the frequency vs. time spectra are shown in the center column, the blurring of the spectrum with increased modulation frequency is due to the limited bandwidth (160 MHz) of the spectrum analyzer. In all figures, same as Fig. 2, the device is free running without active feedback, and the pump-laser-cavity detuning is self-stabilized by the photorefractive effect.

