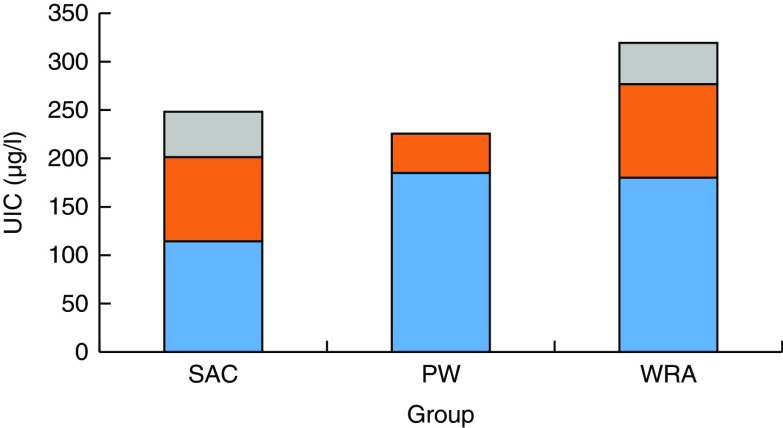
Fig. 3.
(colour online) Constituent components ( , iodine from table salt;
  , iodine from salt used in processed foods;
  , native iodine) of urinary iodine concentration (UIC) according to population group (SAC, school-age children; PW, pregnant women; WRA, non-pregnant women of reproductive age) Armenia, September–November 2016

