
Figure 4.
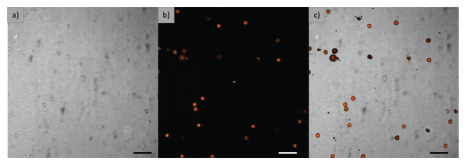
Cell detection. (a) Optical microscopy view, (b) fluorescence view, and (c) digital superposition image of both optical and fluorescence images. Dimension bar represents 100 μm.
Official websites use .gov
A
.gov website belongs to an official
government organization in the United States.
Secure .gov websites use HTTPS
A lock (
) or https:// means you've safely
connected to the .gov website. Share sensitive
information only on official, secure websites.
Cell detection. (a) Optical microscopy view, (b) fluorescence view, and (c) digital superposition image of both optical and fluorescence images. Dimension bar represents 100 μm.