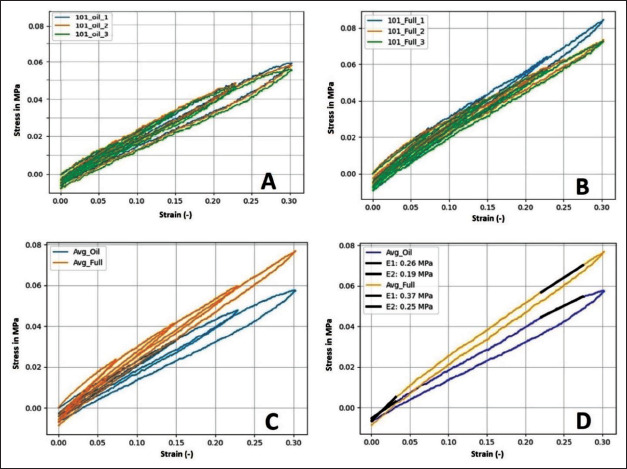
Figure 7.

(A) Tensile behavior of the individual fluid-filled specimens over all four loading cycles. (B) Tensile behavior of the individual full silicone specimens. (C) Average tensile behavior of the fluid-filled tensile testing specimens compared to the full silicone ones. (D) Comparison in average behavior over the last loading cycle only, also with comparison between the initial (E1 between 0% and 3% strain) and final (E2 between 22% and 27% strain) tensile moduli.
