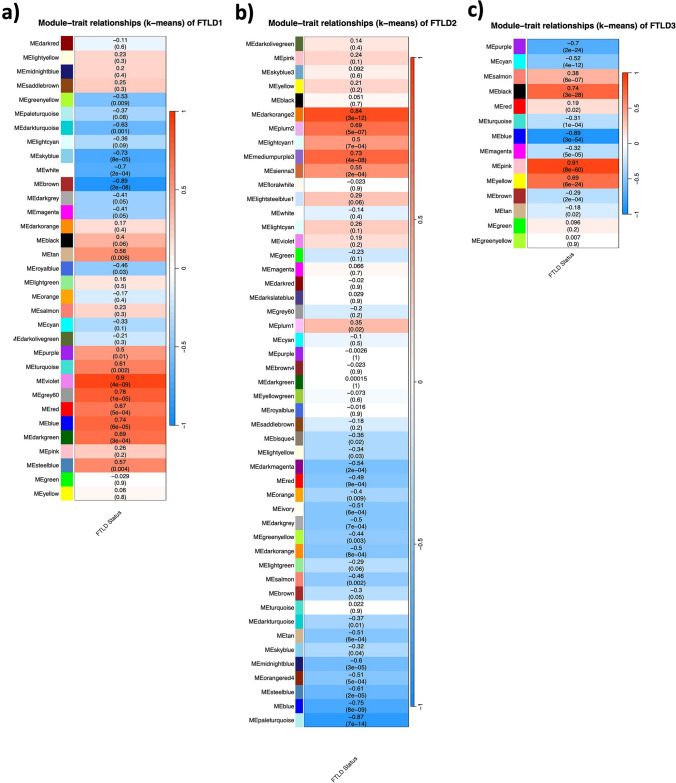
Fig. 7.
Module-trait correlations for the FTLD co-methylation networks. a FTLD1; b FTLD2; c FTLD3. The rows represent the co-methylation module eigengenes (ME) and their colours, and the column represents the correlation of the methylation levels of CpGs in each module with the disease status. p-values are presented within each cell and the colour scale at the right indicates the strength of the correlation (darker cells depict stronger correlations, with blue representing negative and red representing positive correlations)

