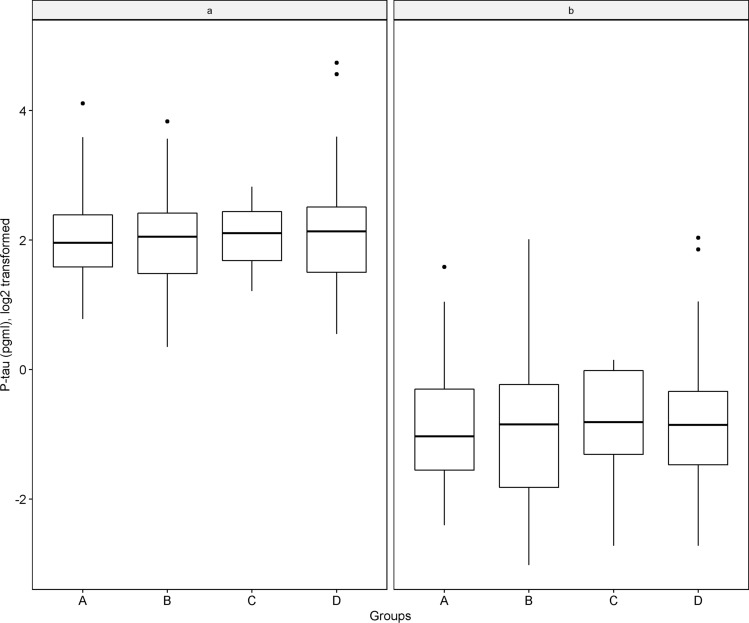
Fig. 3.
shows the levels of plasma p-tau measures by mixed AD groups (A: AD only, B: AD mixed with vascular conditions, C: AD mixed with other degenerative conditions, and D: AD mixed with vascular and other degenerative conditions). Each panel, with plasma p-tau181 on the left (a) and p-tau217 on the right (b), is a boxplot with the height of each box representing the interquartile range and line segment inside the box representing the median

