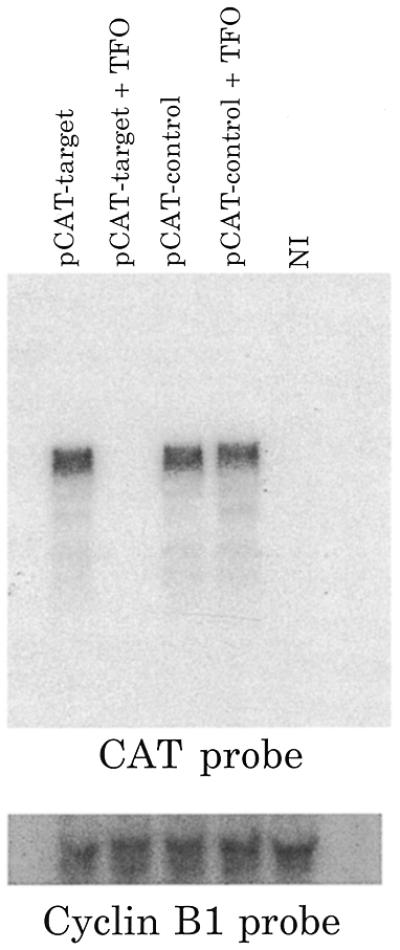
Figure 6.

Northern blot analysis of injected oocytes. Comparison of total RNA isolated from oocytes injected with pCAT-control and pCAT-target injected with and without TFO. Non-injected (NI) oocytes served as a negative control. Cyclin B1 probe and ethidium bromide staining served to control for even extraction and loading of RNA.
