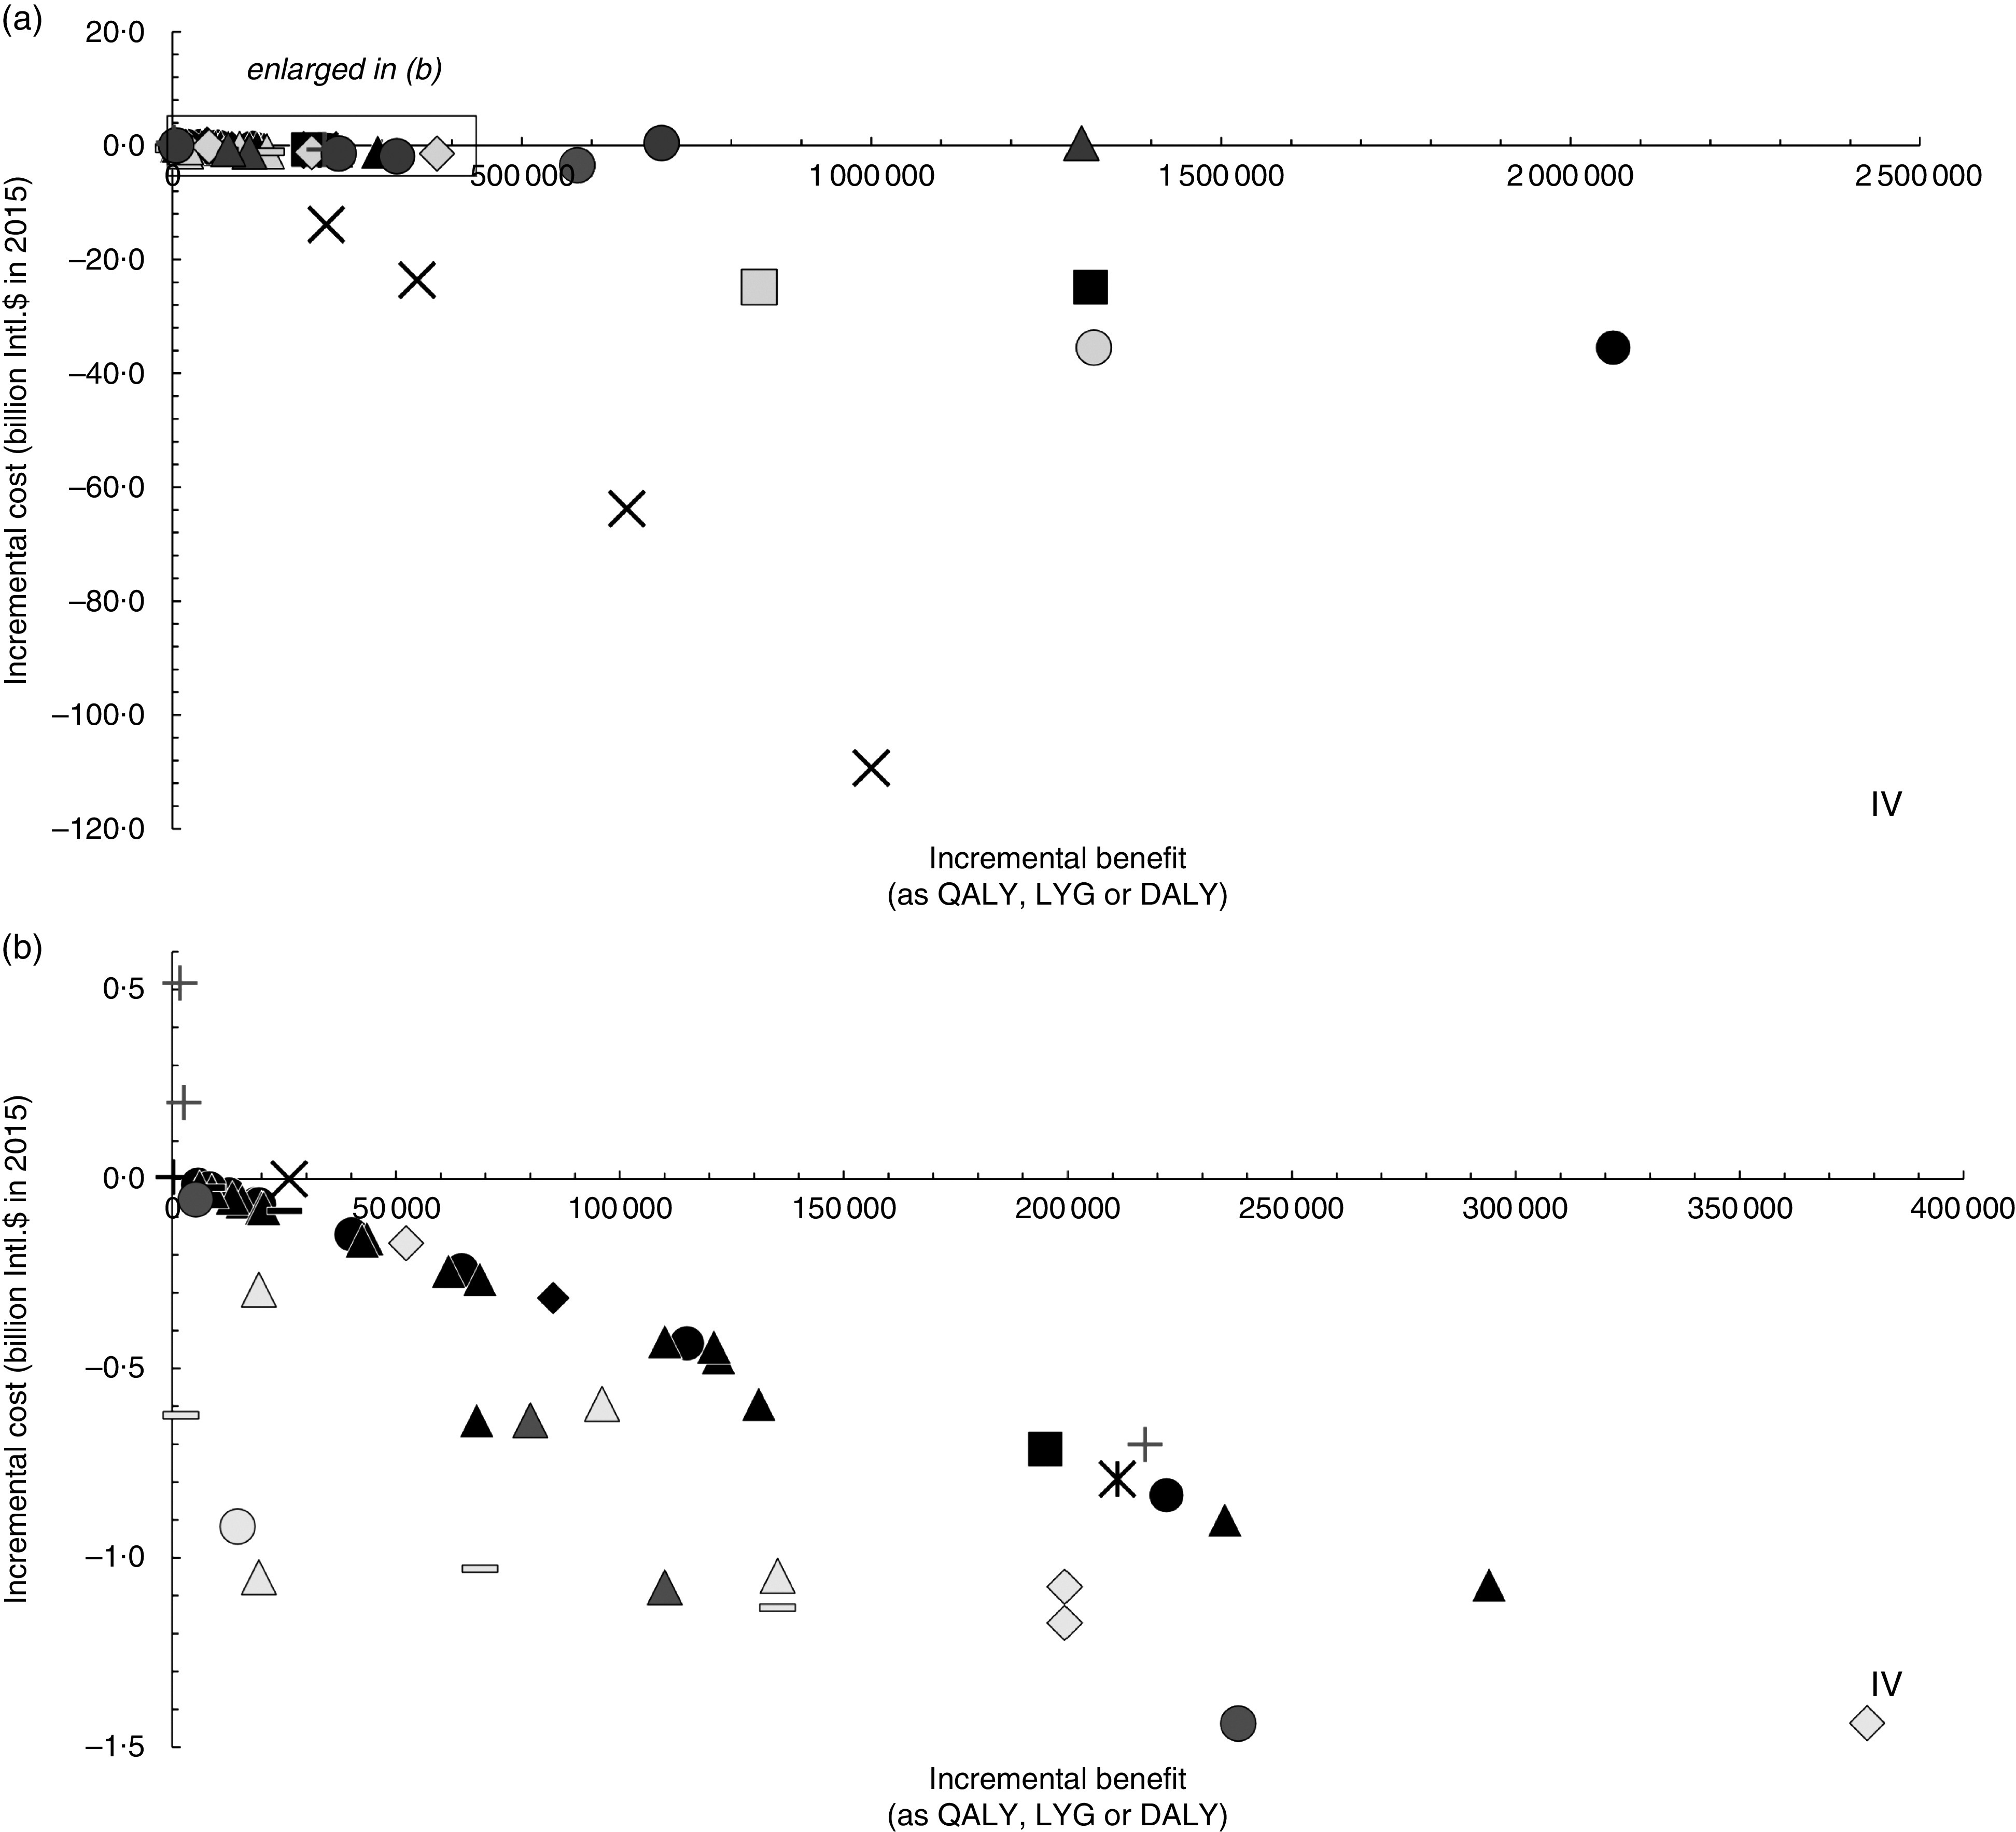
Fig. 2.

Cost-effectiveness plane of salt reduction scenarios: (a) display of the sixty-two modelled scenarios in the included studies; (b) enlarged display of fifty-one scenarios as indicated by the selection box in Fig. 2(a). Incremental benefit is measured as quality-adjusted life years (QALY) gained, life years gained (LYG) or disability-adjusted life years (DALY) saved, incremental cost in international dollars (Intl.$) in 2015 (base scenarios of original studies); ●, voluntary salt reduction; ▲, mandatory salt reduction; ■, sodium/salt tax;  , not specified; +, dietary advice; –, salt-specific health education (via labelling or salt awareness campaigns); ♦, combination of different approaches (e.g. health education, salt reduction in processed foods, labelling and/or taxes);
  , cap-and-trade approach. Outcome measure as: ■, QALY;
  , LYG;
  , DALY. Note: Interventions in the 4th quadrant (IV) are considered cost-saving (i.e. higher benefit at lower cost compared with status quo); results in the 1st quadrant (I) are associated with higher benefit at higher cost
