
Fig. 1.
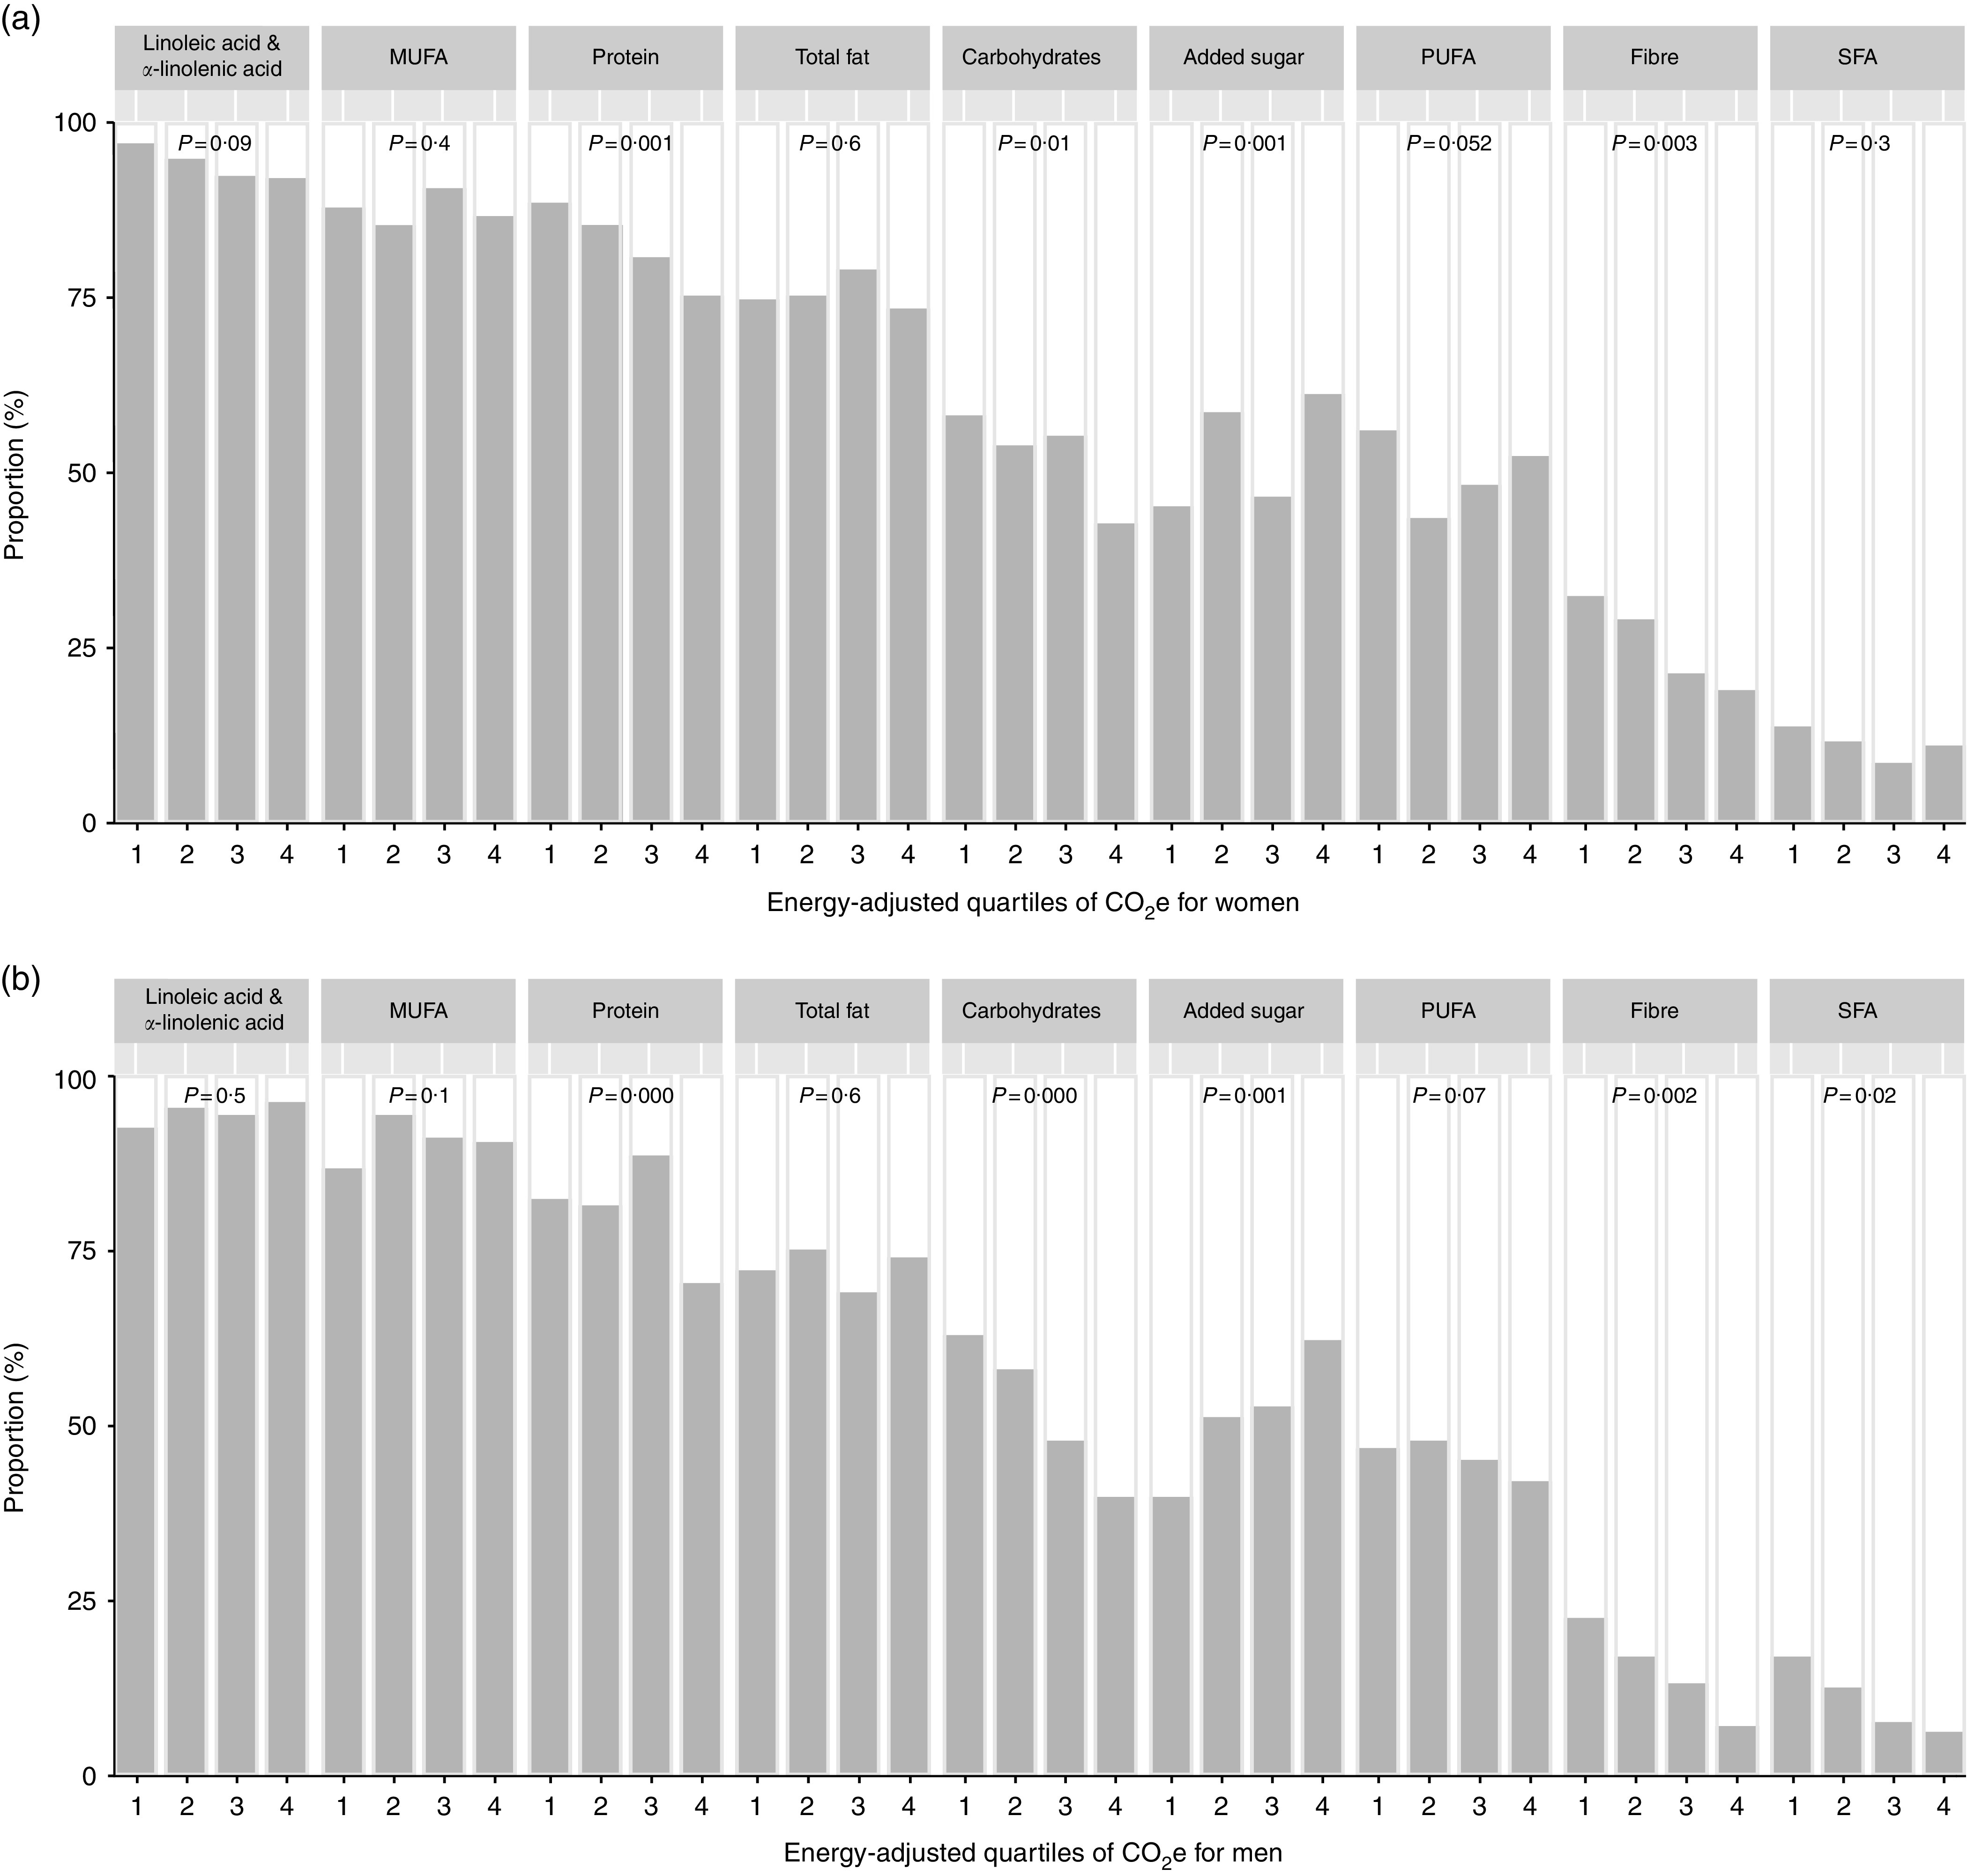
Proportion of participants adhering to the Nordic Nutrition Recommendations 2012 for macronutrients ( , adhering;
  , not adhering), by quartiles of increasing levels of dietary GHGE adjusted for total energy intake, among (a) 840 women and (b) 627 men, Riksmaten adults 2010–11 survey, Sweden. Quartile 1 is the lowest and 4 the highest GHGE group. P values are from χ
2 test (GHGE, greenhouse gas emissions; CO2e, carbon dioxide equivalents)
, not adhering), by quartiles of increasing levels of dietary GHGE adjusted for total energy intake, among (a) 840 women and (b) 627 men, Riksmaten adults 2010–11 survey, Sweden. Quartile 1 is the lowest and 4 the highest GHGE group. P values are from χ
2 test (GHGE, greenhouse gas emissions; CO2e, carbon dioxide equivalents)