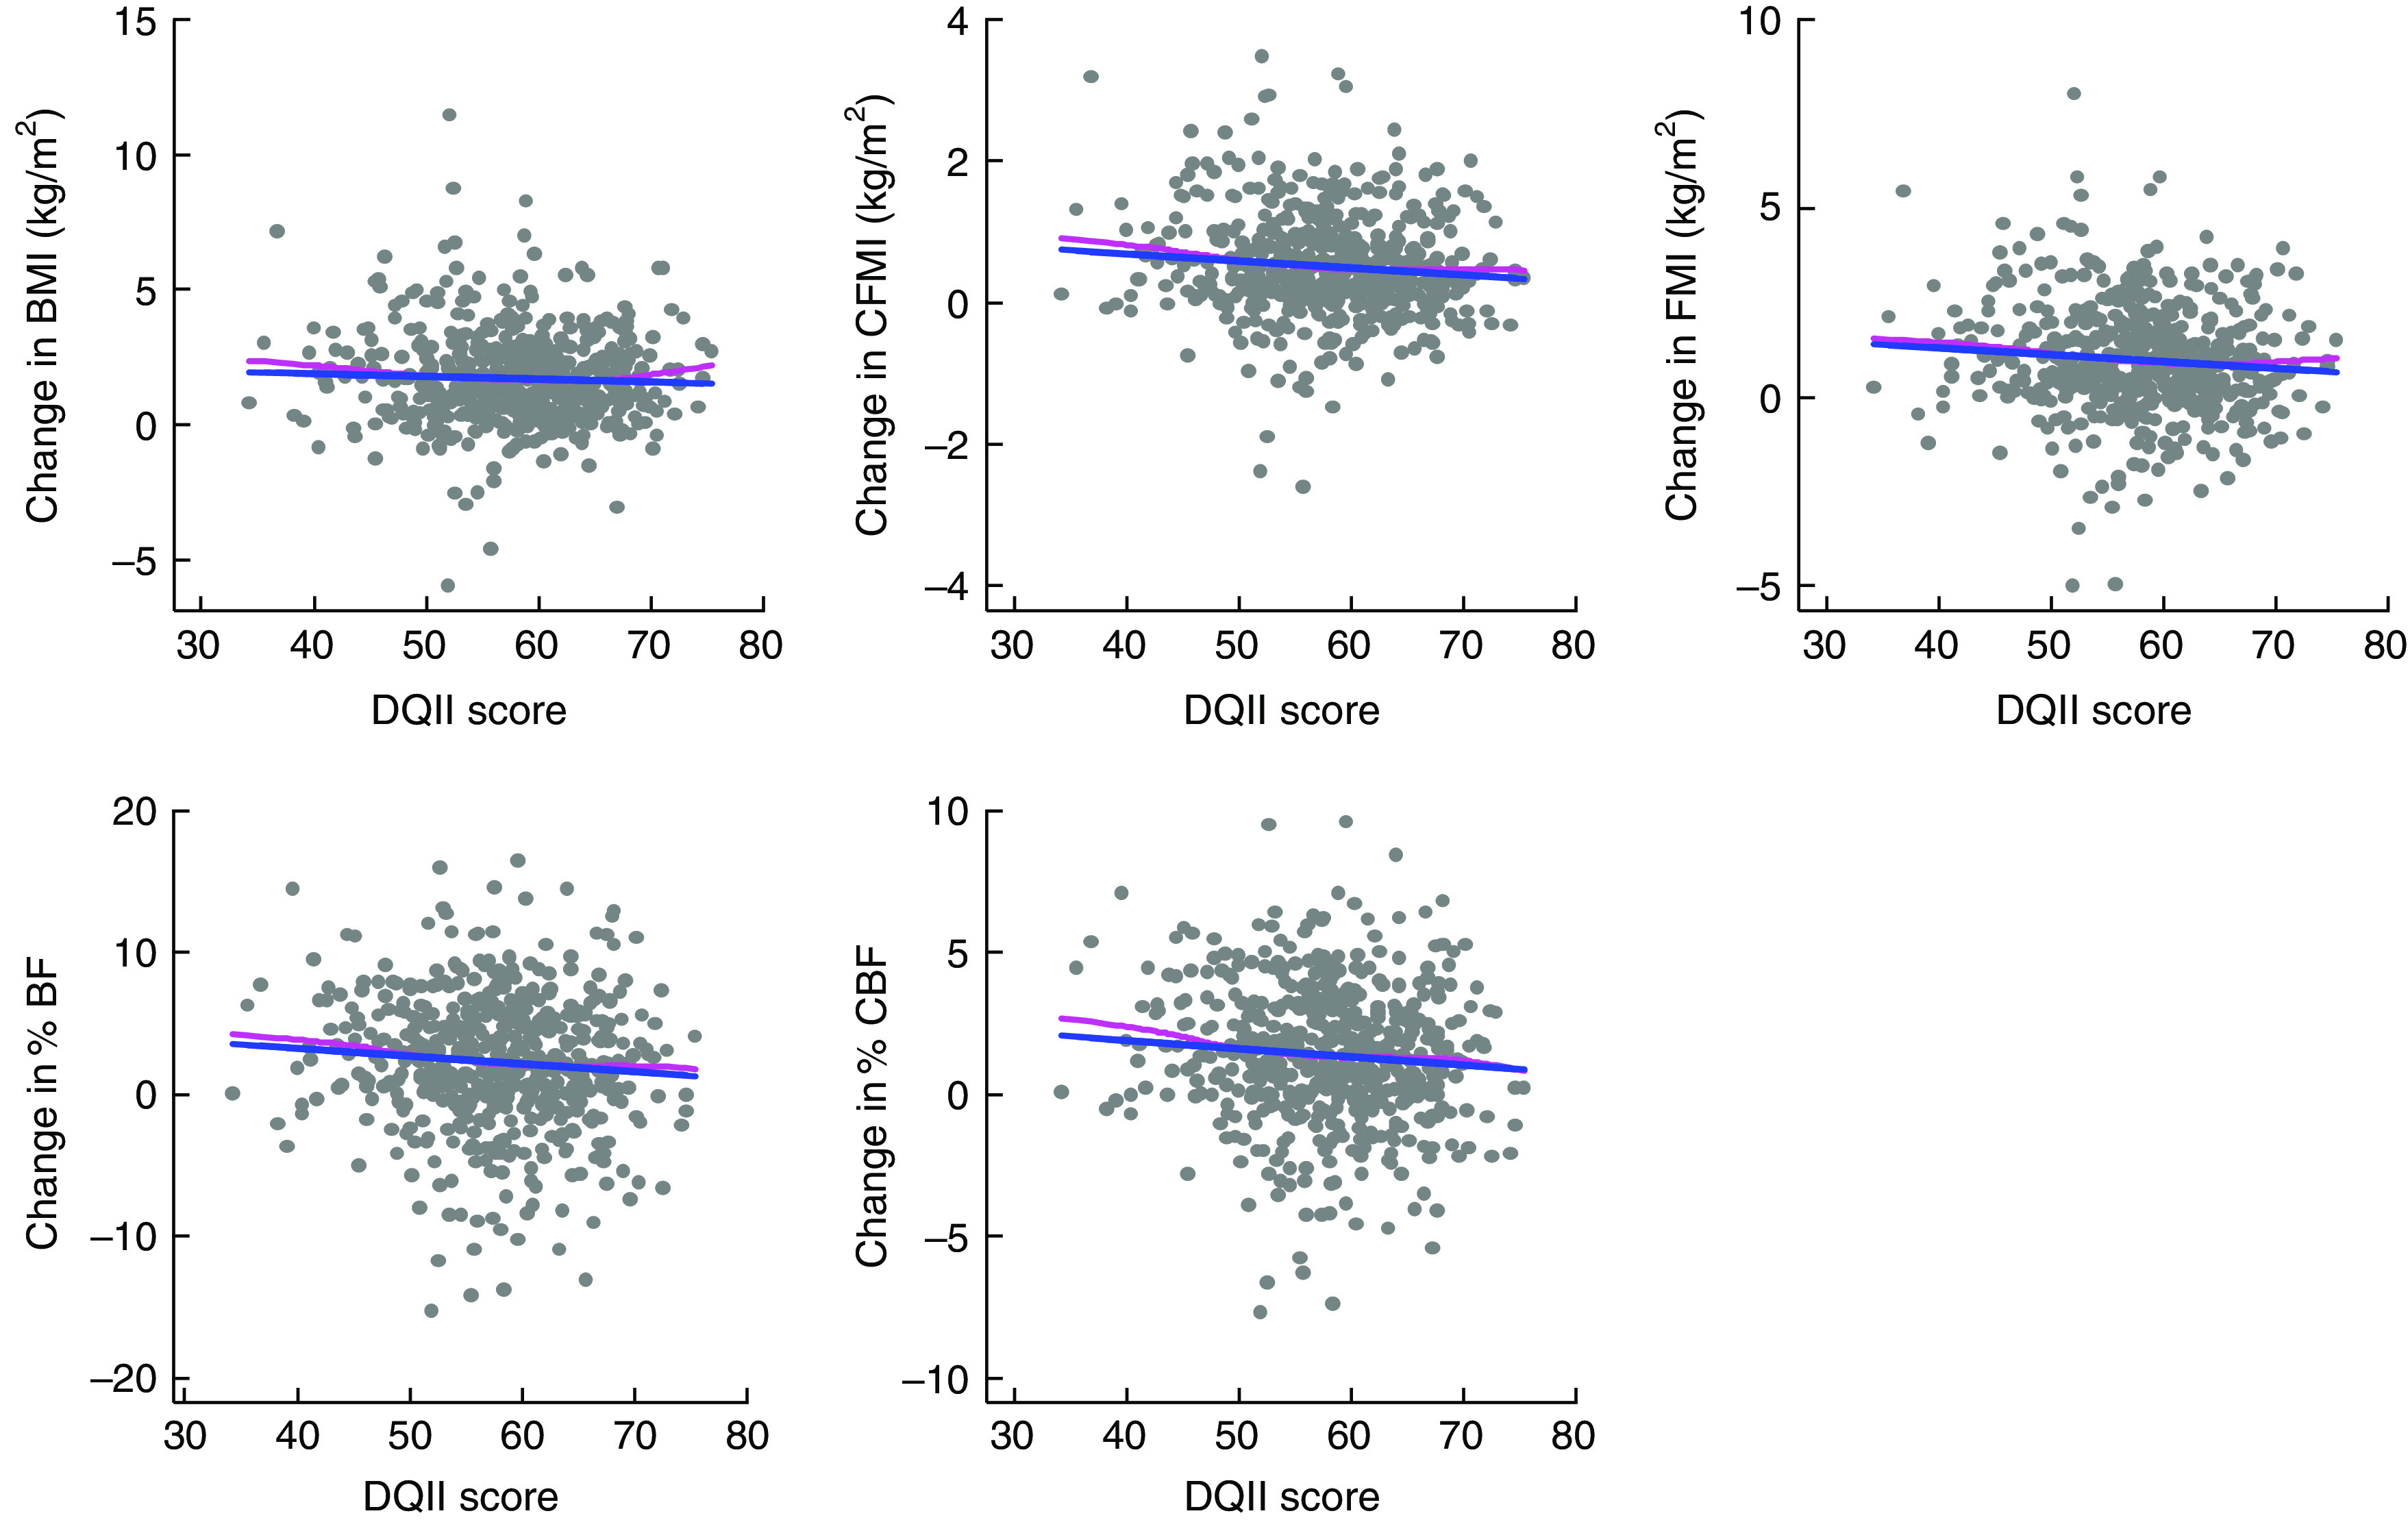
Fig. 2.

Association of Diet Quality Index–International (DQII) score with changes in adiposity between baseline and 2-year follow-up in 546 Canadian children (244 girls and 302 boys) participating in the QUALITY (QUebec Adipose and Lifestyle InvesTigation in Youth) study:  , Loess (local regression of the association between diet quality and changes in adiposity and BMI);
  , linear least-squares regression of the association between diet quality and changes in adiposity and BMI (CFMI, central fat mass index; FMI, fat mass index; %BF, percentage body fat; %CBF, percentage central body fat)
