
Figure 3.
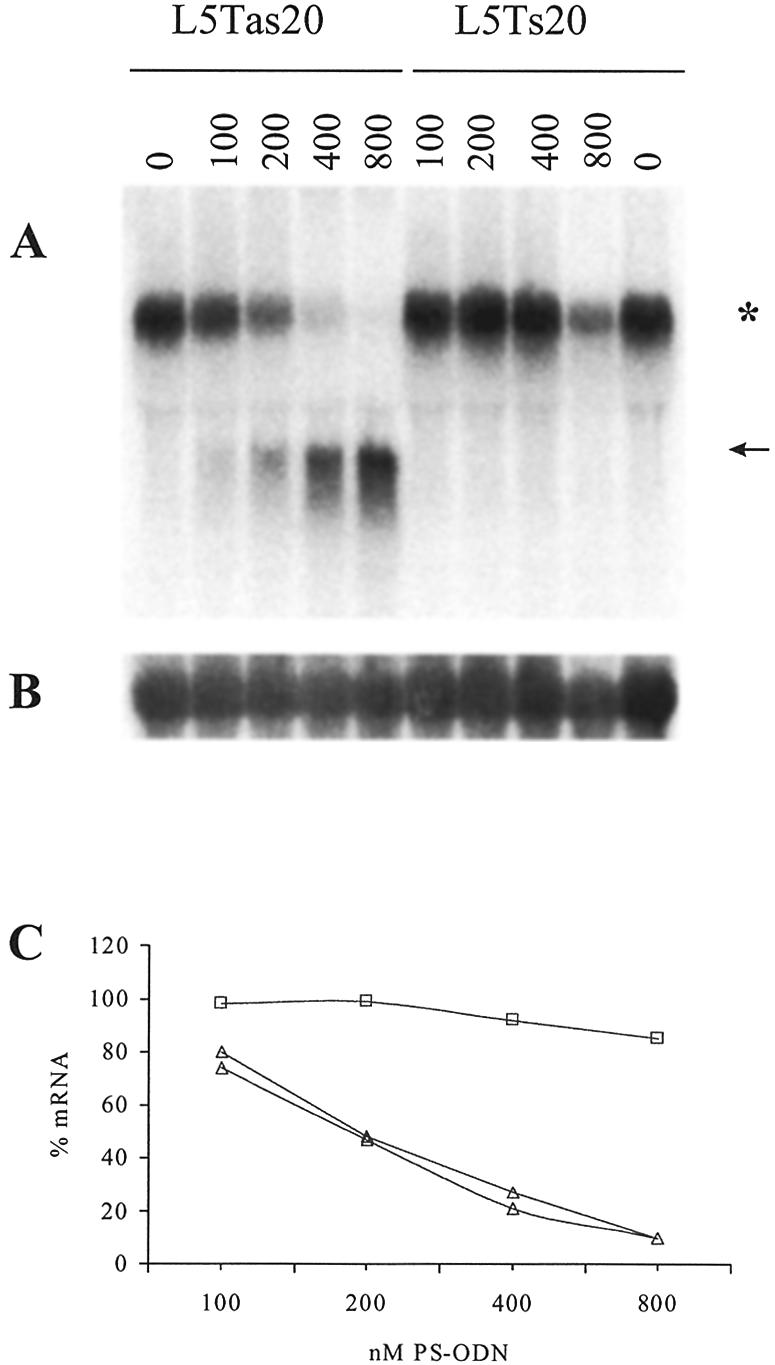
Northern blot analysis of a dose–response series of L5Tas20 on MiaPacaII cells. Cells were transfected with a concentration series of antisense ODN L5Tas20 and the sense control ODN L5Ts20. RNA was extracted 20 h post-transfection. Concentration of ODNs (in nM) are given on top of the lanes. (A) 5′POL probe, the asterisk indicates the mRNA, the arrow indicates the cleaved 5′ product RNA; (B) 28S RNA control hybridization; (C) graphical presentation of the POLR2A mRNA levels, quantified and corrected for RNA loading using the 28S RNA signal, as percentage of the POLR2A mRNA level in the mock-treated cells: squares, sense ODN values; triangles, antisense ODN values of two independent experiments.