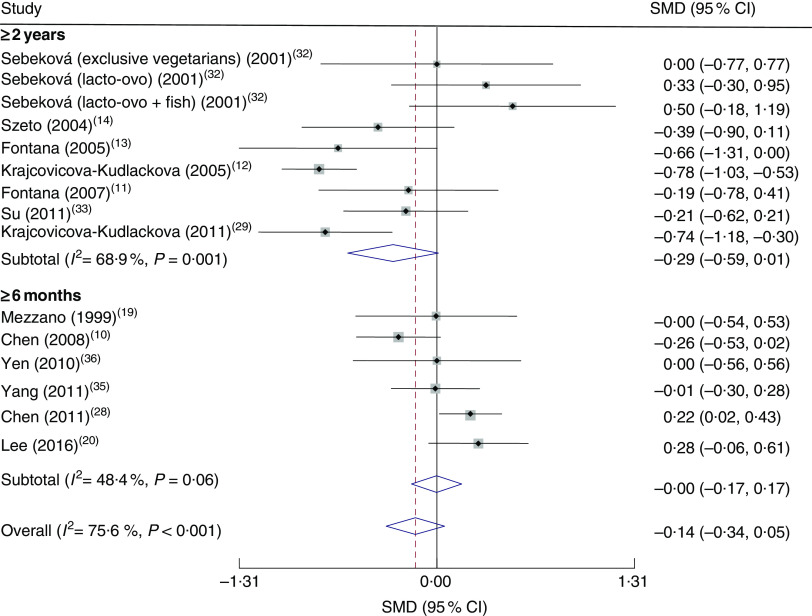
Fig. 3.
Forest plot showing the overall effect of vegetarianism on C-reactive protein levels compared with omnivores by minimum duration of vegetarianism. Results are effect size, presented as summarized mean difference (SMD), and 95 % CI. The study-specific SMD and 95 % CI are represented by the black diamond and horizontal line, respectively; the area of the grey square is proportional to the specific-study weight to the overall meta-analysis. The centre of the open diamond and the vertical dashed line represent the overall effect size of all studies; the width of the diamond represents the overall pooled 95 % CI

