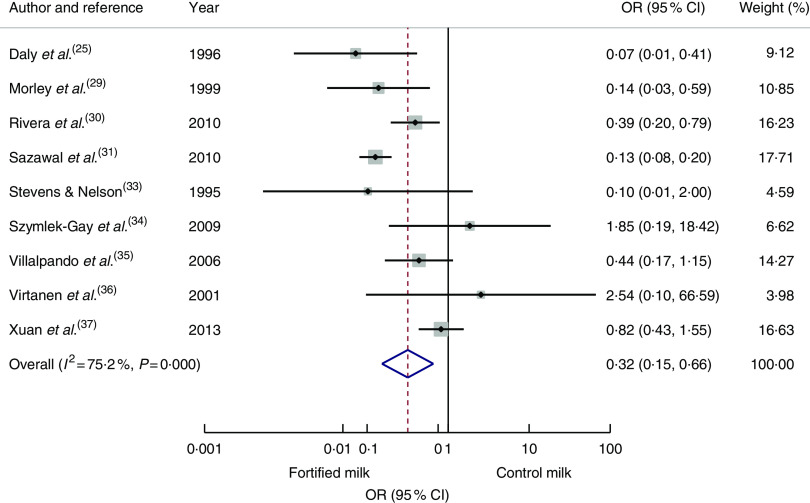
Fig. 3.
(colour online) Forest plot: odds of anaemia with fortified milk compared with control milk among 6–47-month-old children. The study-specific OR and 95 % CI are represented by the black dot and horizontal line, respectively; the area of the grey square is proportional to the specific-study weight to the overall meta-analysis. The centre of the open diamond/vertical dashed line represents the pooled OR difference and the width of the diamond represents the pooled 95 % CI. The solid vertical line represents no effect

