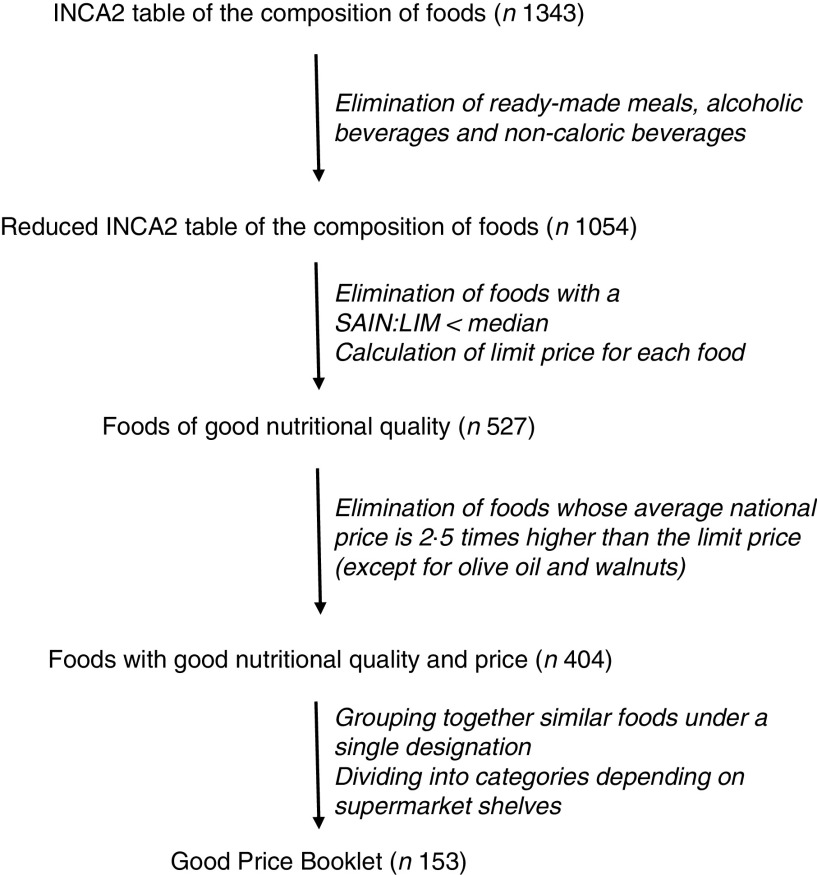
Fig. 1.
Flowchart showing how foods were selected for the Good Price Booklet (INCA2, second French national cross-sectional dietary study; SAIN, indicator that estimates foods’ positive aspects; LIM, indicator that estimates foods’ negative aspects; limit price for a given food corresponds to the first tertile of the mean prices of foods in the group to which that food belongs)

