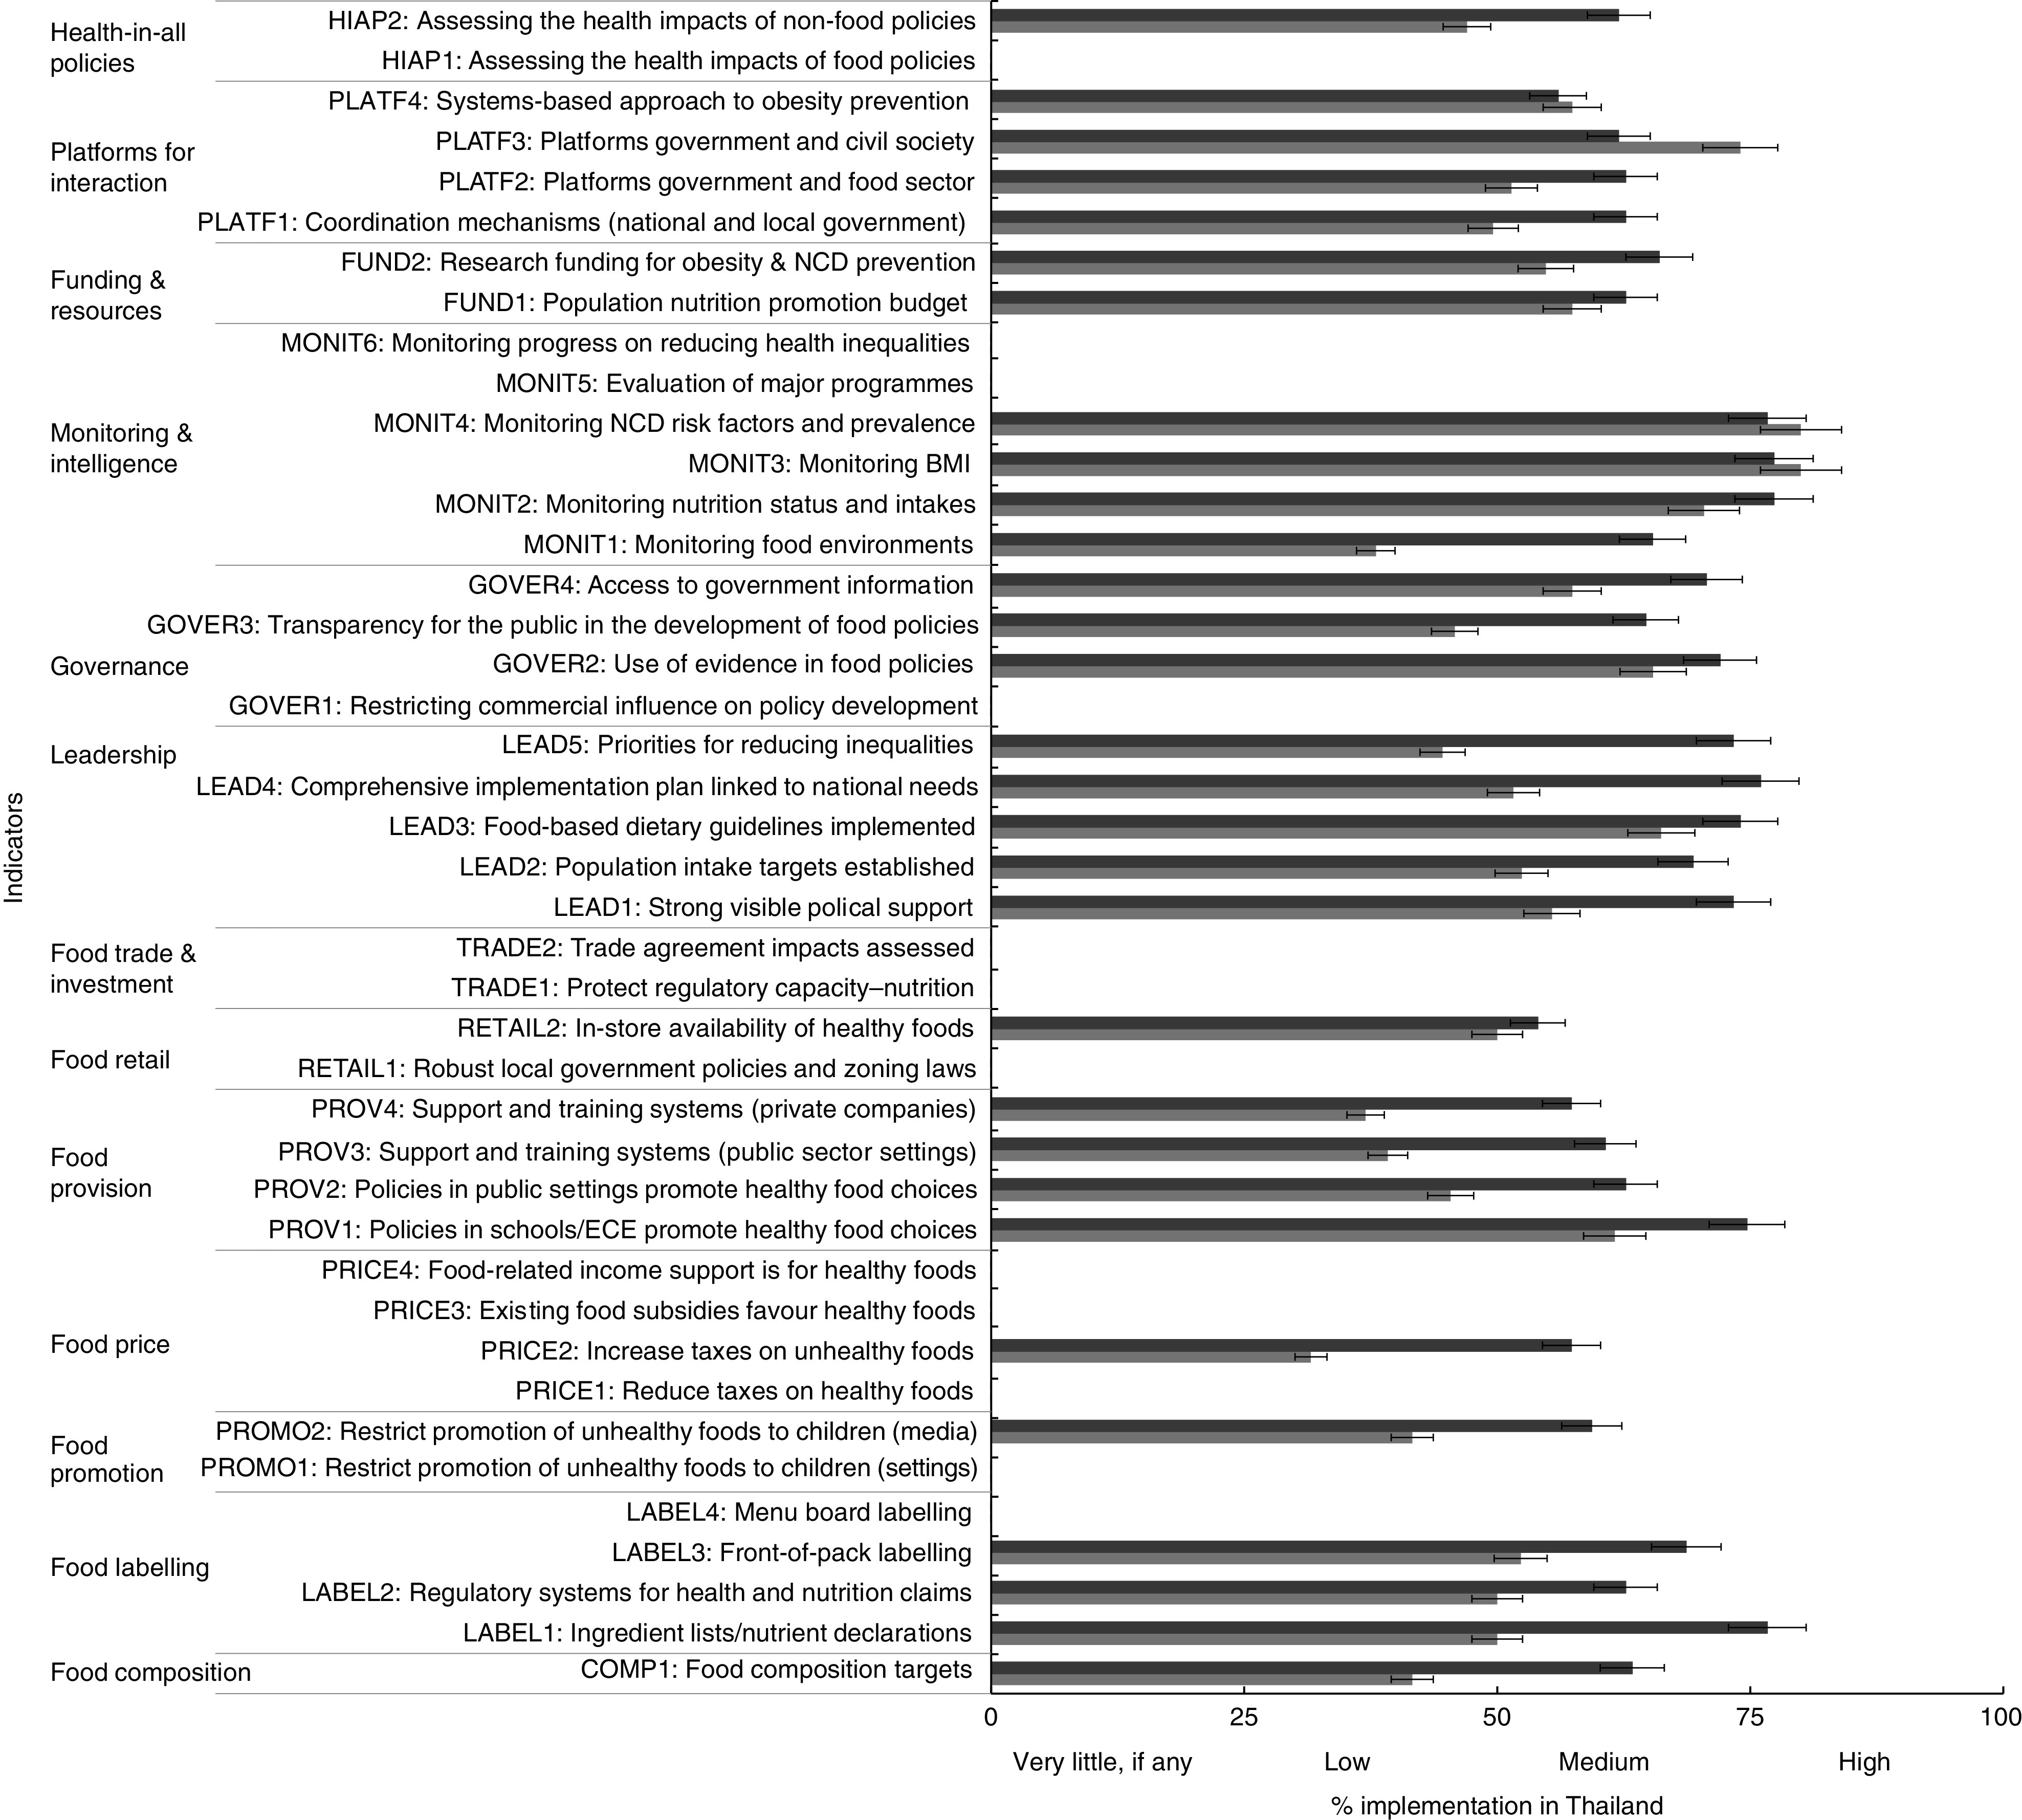
Fig. 2.

Level of government implementation of food environment policies and infrastructure support for policy implementation by state ( ) and non-state actors (
 ) in Thailand. Error bars show 5 % positive and negative potential error amounts (NCD, non-communicable disease; ECE, early childhood education)
