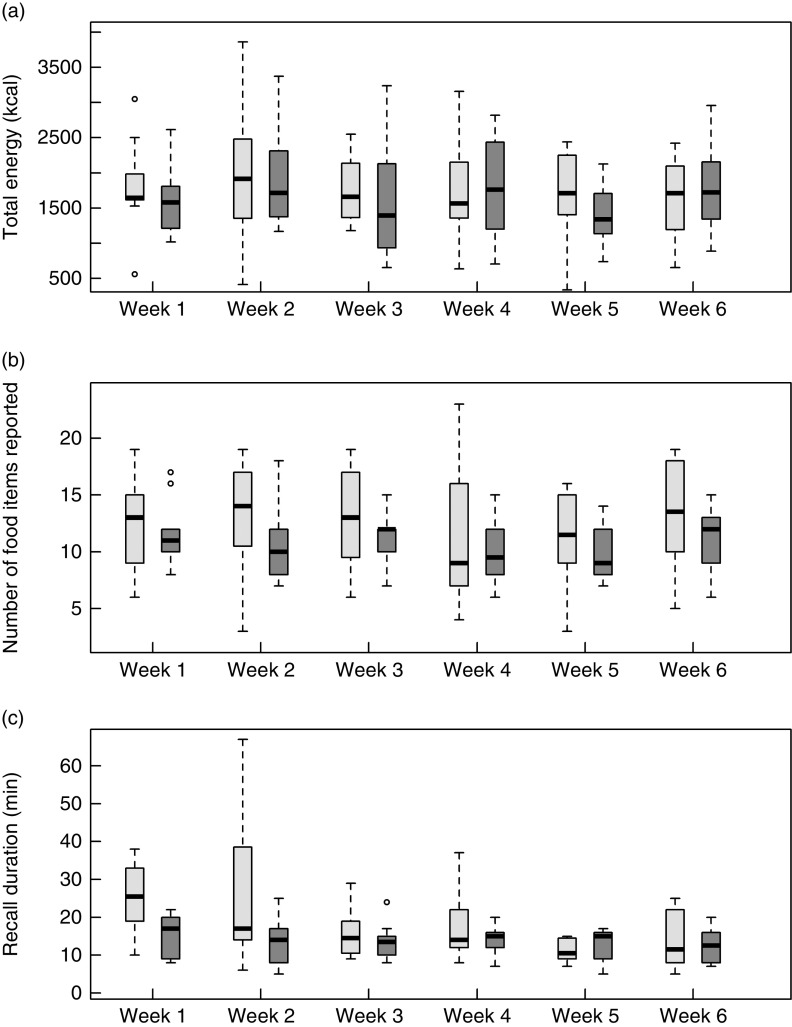
Fig. 1.
Box-and whisker plots comparing the Automated Self-Administered 24-Hour dietary recall (ASA24-Kids-2014;  ) and the interviewer-administered 24 h dietary recall (
 ) at weeks 1 through 6 for adolescents aged 12–17 years (n 20) in Study 1: (a) total energy (to convert to kJ, multiply kcal value by 4·184); (b) food items reported; and (c) duration of recall. The solid line within the box represents the median value; the top and bottom of the box represent the 75th and 25th percentile, respectively; the whiskers represent values falling within 1·5 times the interquartile range; and data points falling outside these limits are plotted as circles

