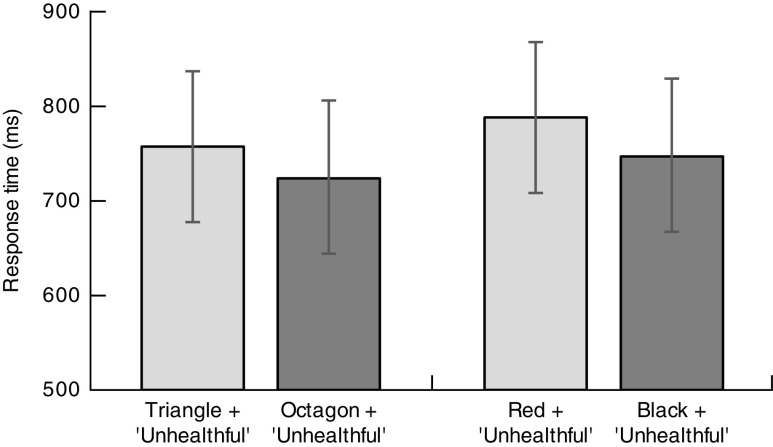
Fig. 4.
Average response times (in ms) for trials in Study 4 with different combinations of words and shape (left) and words and colour (right) in the implicit association test* completed by Uruguayan adults (n 88) aged 18–63 years. Values are means with their standard deviations represented by vertical bars. *The figure shows the shapes and colours associated with the word ‘unhealthful’. The word ‘healthful’ was associated with the opposite shape or colour

