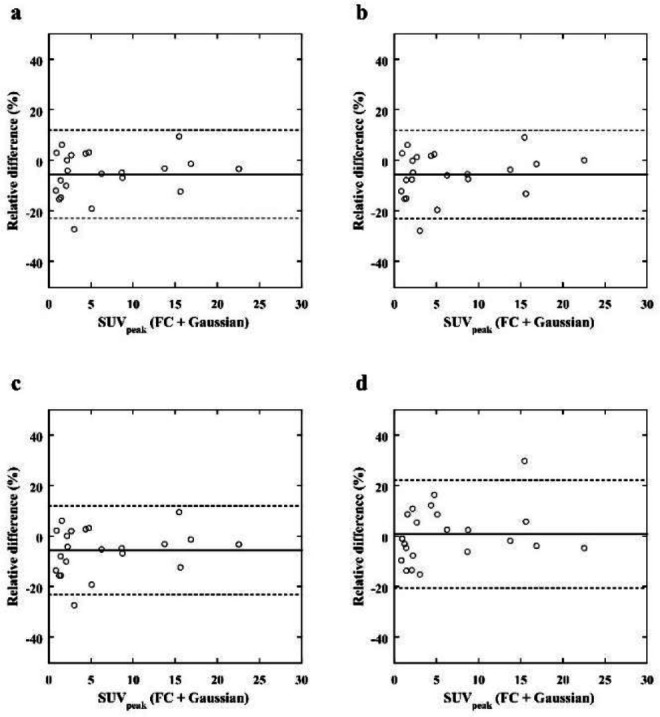
Figure 9.

Bland– Altman plot of the relative differences in the SUVpeak of breast lesions between the reference (FC + Gaussian) images and the LC (a), LC + Gaussian (b), LC + NLM (c), and LC + DL (d) target images. The solid and dashed lines indicate the mean bias and variance, respectively. The bias of the relative differences in the LC + DL images is smaller than those of the other images
