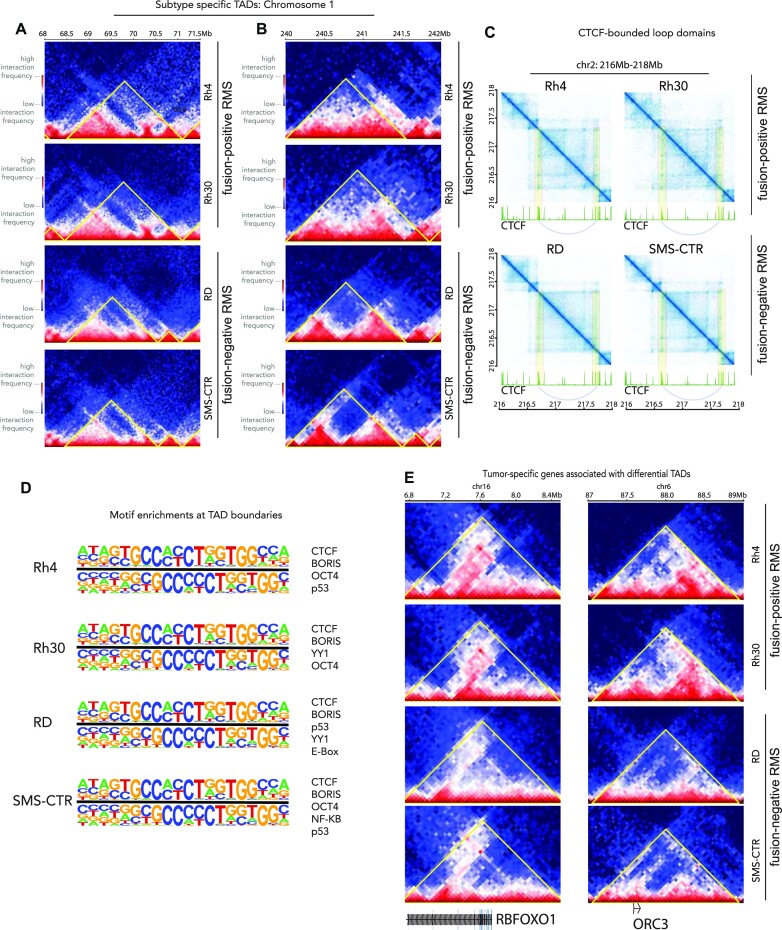
Figure 2.
TADs in RMS. (A, B) Subtype-specific TADs are shown on chromosome 1 for Rh4, Rh30, RD and SMS-CTR with a colorimetric interaction intensity scale (shown, left) and subtypes (shown, right). (C) CTCF-bounded loop domains are shown with interaction intensity plotted in blue above CTCF ChIP-seq data for each cell line in green. Looping interactions are highlighted in yellow with arcs connecting the loop anchors on the ChIP-seq plots. (D) The most highly enriched motifs (top sequences, left; top TFs, right) at TAD boundaries are indicated for Rh4, Rh30, RD and SMS-CTR. (E) Tumor-specific genes associated with differential TADs in our RMS cell models are indicated.

