Figure 3.
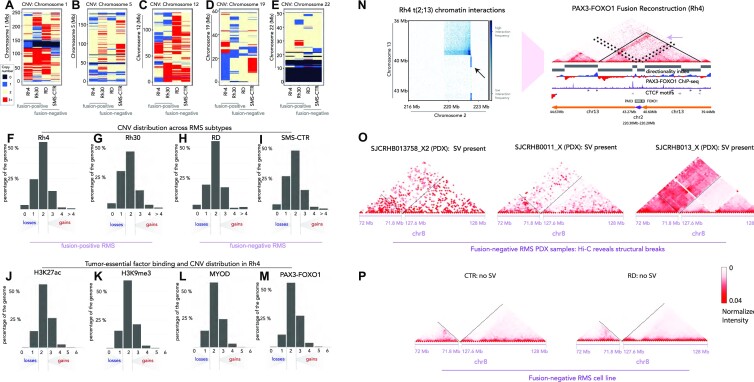
CNVs and SVs from Hi-C. CNV is indicated with colorimetric scale for Rh4, Rh30, RD and SMS-CTR for chromosome 1 (A), chromosome 5 (B), chromosome 12 (C), chromosome 19 (D) and chromosome 22 (E). On the scale, black = deletion/loss, blue = single copy, beige = two copies and red = three or more copies. The distributions of CNV gains and losses are shown for Rh4 (F), Rh30 (G), RD (H) and SMS-CTR (I) as a function of percent coverage across the genome on the y-axis. Fusion status for each cell line is indicated beneath the plot. The association of chromatin regulatory factors and histone marks with CNV in Rh4 cells is shown as a function of deposition of H3K27ac (J), H3K9me3 (K), MYOD binding (L) or PAX3–FOXO1 binding (M). Heatmaps detailing the translocation at PAX3 (chr2) and FOXO1 (chr13) loci in Rh4 FP-RMS cells (N). Recurrent patterns of SV along chromosome 8 are present with increased interaction frequencies between 71.8 and 127.6 Mb for FN-RMS PDXs, SJCRH13758_X2, SJCRHB0011_X and SJCRHB013_X (O), which is lacking in the FN-RMS cell lines RD and SMS-CTR (P).

