
FIGURE 2.
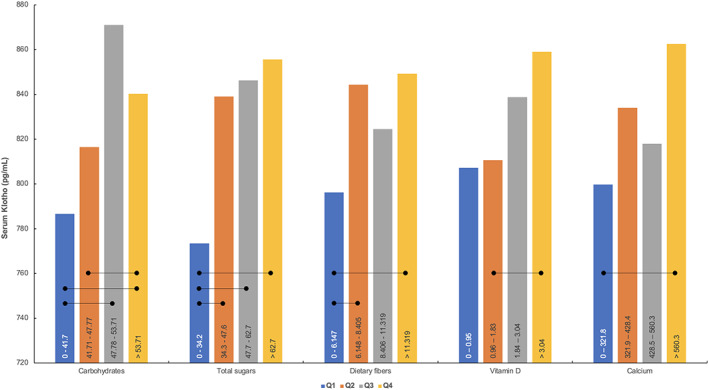
Mean serum Klotho concentrations across quartiles for intakes of carbohydrates (% of energy), total sugars (g/1000 kcal/day), dietary fibers (g/1000 kcal/day), vitamin D (mcg/1000 kcal/d), and calcium (mg/1000 kcal/d). The dietary intakes per quartile are depicted inside the bars for each nutrient. Error bars are removed for clarity. Rounded lines mark significant differences between quartiles at p < .05.