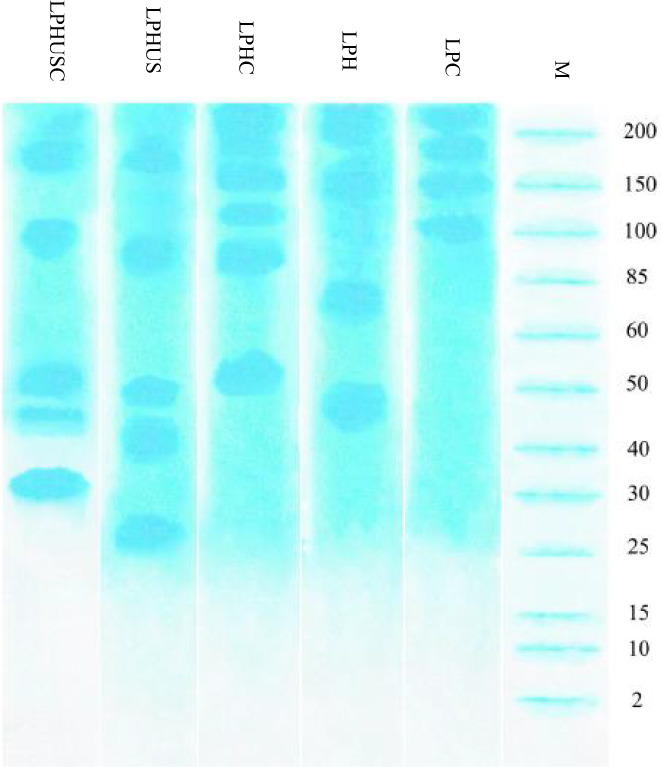
FIGURE 1.

SDS‐PAGE patterns of LPC (control), LPH, LPHC, LPHUS, and LPHUSC. LPC was native lentil protein; LPH was Alcalase–Flavourzyme hydrolysates; LPHC was MTGase cross‐linked LPH; LPHUS was treated LPH with ultrasound; LPHUSC was LPH treated with ultrasound and MTGase.
