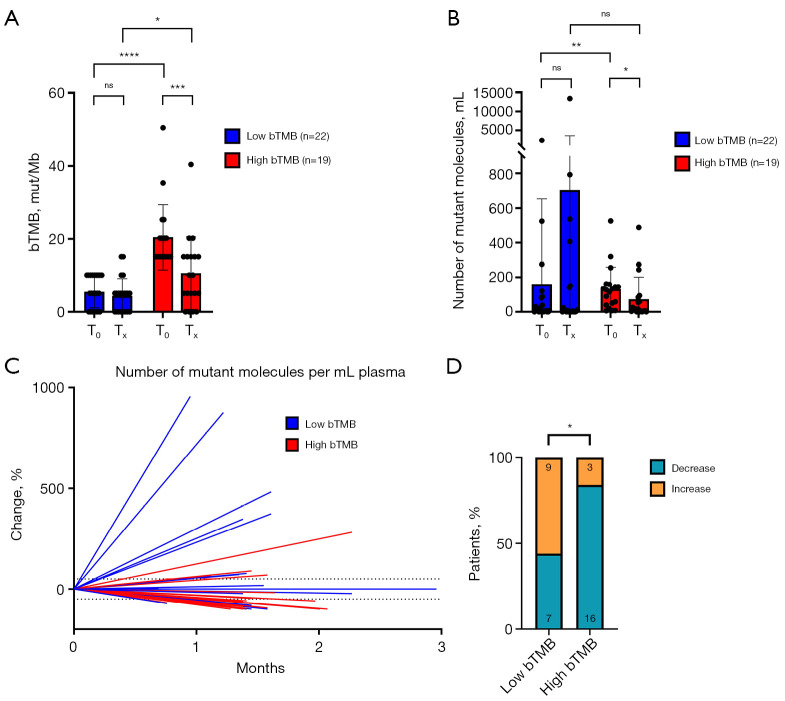
Figure 4.
Dynamics in ctDNA after 1–2 cycles of treatment. (A) Changes in bTMB and (B) changes in number of mutant molecules per mL plasma according to mutational group. (C) Percent change in the number of mutant molecules per mL plasma, with blue lines representing patients with low baseline bTMB and red lines representing patients with high baseline bTMB. Dotted lines represent 50% change. (D) Proportion of patients in each bTMB group experiencing either decrease or increase in number of mutant molecules per mL. *, P≤0.05; **, P≤0.01; ***, P≤0.001; ****, P≤0.0001. bTMB, blood tumor mutational burden; ctDNA, circulating tumor DNA; ns, not significant; T0, pre-treatment sample; Tx, sample after 1–2 cycles of treatment.

