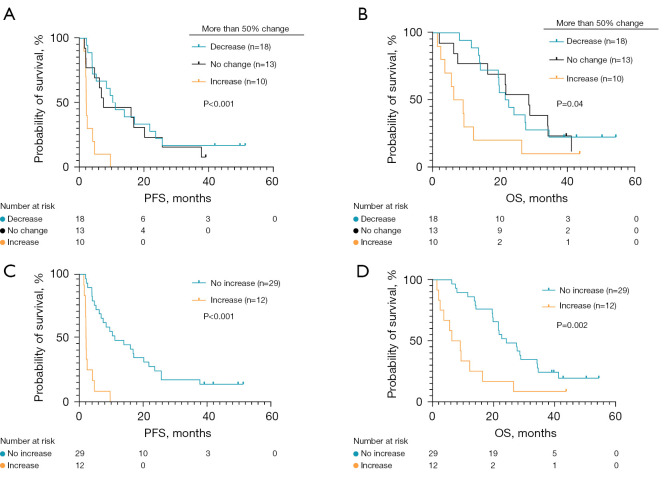
Figure 5.
Dynamics in the number of mutant molecules per mL plasma. (A,B) Kaplan-Meier survival analysis according to change in ctDNA with a threshold of 50% for change. (C,D) Kaplan-Meier survival analysis for patients experiencing any increase in ctDNA. OS, overall survival; PFS, progression-free survival.

