. 2023 Apr 11;29(12):2299–2309. doi: 10.1158/1078-0432.CCR-22-3894

Figure 3.

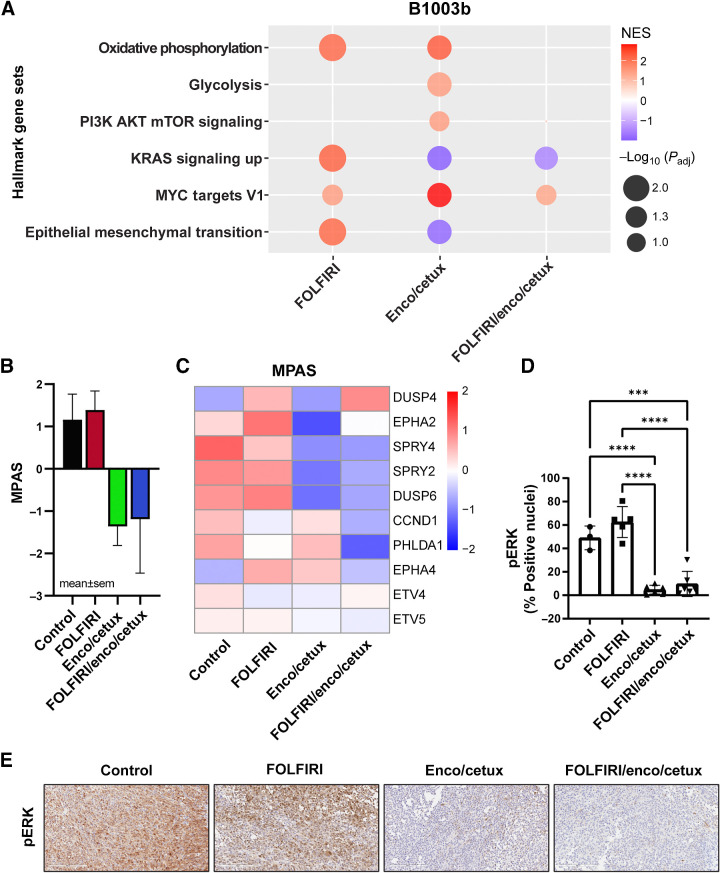
Figure 3. Transcriptional changes after cytotoxic chemotherapy and targeted therapy of B1003b 21-day treated tumors. A, GSEA analysis of hallmark gene sets between treatment samples (FOLFIRI, E+C, or FOLFIRI + E+C) relative to controls. A bubble plot was colored by normalized enrichment score (NES) and the size of the bubbles represent adjusted P values. Red bubbles indicate gene sets that are more enriched after treatment (NES > 0), whereas blue bubbles represent gene sets enriched in control samples (NES < 0). B, MPAS and C, Heatmap of 10 MAPK target genes average expression after cytotoxic chemotherapy and targeted therapy. D, Percentage of positive nuclei/cells in were compared between treatment groups (n = 4–6). *, P < 0.05; **, P < 0.01; ***, P < 0.001; ****, P < 0.0001. E, IHC staining (20×) identifying the pERK in B1003b tissue among four treatments.

Transcriptional changes after cytotoxic chemotherapy and targeted therapy of B1003b 21-day treated tumors. A, GSEA analysis of hallmark gene sets between treatment samples (FOLFIRI, E+C, or FOLFIRI + E+C) relative to controls. A bubble plot was colored by normalized enrichment score (NES) and the size of the bubbles represent adjusted P values. Red bubbles indicate gene sets that are more enriched after treatment (NES > 0), whereas blue bubbles represent gene sets enriched in control samples (NES < 0). B, MPAS and C, Heatmap of 10 MAPK target genes average expression after cytotoxic chemotherapy and targeted therapy. D, Percentage of positive nuclei/cells in were compared between treatment groups (n = 4–6). *, P < 0.05; **, P < 0.01; ***, P < 0.001; ****, P < 0.0001. E, IHC staining (20×) identifying the pERK in B1003b tissue among four treatments.