. 2023 Apr 18;29(12):2310–2323. doi: 10.1158/1078-0432.CCR-22-2242

Figure 3.

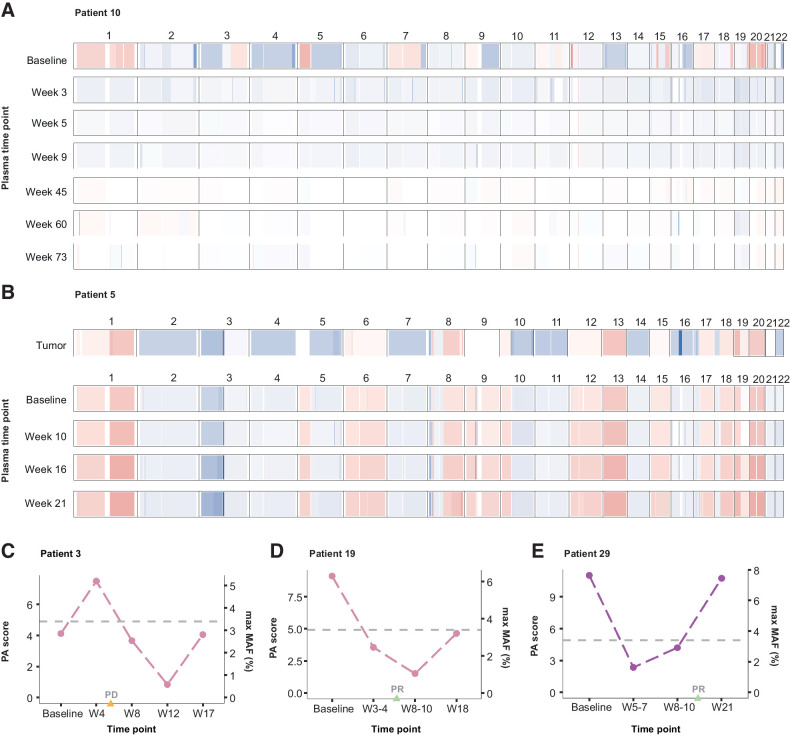
Figure 3. Chromosomal arm-level somatic copy-number profiles and PA. Targeted sequencing data were used to assess genome-wide arm-level SCNAs across serial plasma samples. Representative examples of genome-wide SCNA profiles are shown for 2 patients. A, Patient 10 displayed multiple copy-number gains (chromosomes 1, 3q, 5p, 7, 12p, 15, 17, and 20) and losses (chromosomes 2, 3p, 4, 5q, 8, 9q, 10, 13, and 16) in plasma at baseline sampling. Analysis of these regions across follow-up (week 3–73) plasma samples collected after cisplatin/etoposide treatment indicated a return to normal ploidy, which was detected prior to the radiographic assessment of partial or complete (PR/CR) response at week 11. B, Patient 5 displayed widespread genome-wide copy-number aberrations across tumor (WES; top) and matched serial plasma samples (bottom). This included gains across chromosomes 1, 8, 12, 13, 17, 18, 19, and 20 and losses across chromosomes 2, 3p, 4, 5q, 7, 10q, 11, 14, 16, 21, and 22. All SCNAs detected in the tumor were captured in cfDNA at baseline and persistently across all follow-up time points analyzed in plasma after initiation of second-line ipilimumab/nivolumab combination therapy. This was consistent with a radiographic assessment of PD 5 weeks after initiation of ipilimumab/nivolumab combination therapy. C–E, The most aberrant alterations in individual chromosome arm-level copy number were used to calculate a genome-wide composite measure of PA (termed PA score) for each sample. Examples of longitudinal trends in PA scores are shown for 3 patients who had no detectable tumor-derived sequence alterations across plasma time points analyzed. C, For patient 3, aneuploidy was detected in plasma 4 weeks after baseline sampling, followed by a reduction to normal ploidy by the week 8 timepoint, consistent with an OS time exceeding 21 months from baseline sampling. In contrast, radiographic assessment at week 6 indicated PD for this patient. D–E, Similarly, in patients 19 and 29, aneuploidy was detected at baseline followed by a reduction to normal ploidy by week 3–4 and week 5–7 time points, respectively. This preceded radiographic assessments of PR at weeks 6 and 15, respectively.

Chromosomal arm-level somatic copy-number profiles and PA. Targeted sequencing data were used to assess genome-wide arm-level SCNAs across serial plasma samples. Representative examples of genome-wide SCNA profiles are shown for 2 patients. A, Patient 10 displayed multiple copy-number gains (chromosomes 1, 3q, 5p, 7, 12p, 15, 17, and 20) and losses (chromosomes 2, 3p, 4, 5q, 8, 9q, 10, 13, and 16) in plasma at baseline sampling. Analysis of these regions across follow-up (week 3–73) plasma samples collected after cisplatin/etoposide treatment indicated a return to normal ploidy, which was detected prior to the radiographic assessment of partial or complete (PR/CR) response at week 11. B, Patient 5 displayed widespread genome-wide copy-number aberrations across tumor (WES; top) and matched serial plasma samples (bottom). This included gains across chromosomes 1, 8, 12, 13, 17, 18, 19, and 20 and losses across chromosomes 2, 3p, 4, 5q, 7, 10q, 11, 14, 16, 21, and 22. All SCNAs detected in the tumor were captured in cfDNA at baseline and persistently across all follow-up time points analyzed in plasma after initiation of second-line ipilimumab/nivolumab combination therapy. This was consistent with a radiographic assessment of PD 5 weeks after initiation of ipilimumab/nivolumab combination therapy. C–E, The most aberrant alterations in individual chromosome arm-level copy number were used to calculate a genome-wide composite measure of PA (termed PA score) for each sample. Examples of longitudinal trends in PA scores are shown for 3 patients who had no detectable tumor-derived sequence alterations across plasma time points analyzed. C, For patient 3, aneuploidy was detected in plasma 4 weeks after baseline sampling, followed by a reduction to normal ploidy by the week 8 timepoint, consistent with an OS time exceeding 21 months from baseline sampling. In contrast, radiographic assessment at week 6 indicated PD for this patient. D–E, Similarly, in patients 19 and 29, aneuploidy was detected at baseline followed by a reduction to normal ploidy by week 3–4 and week 5–7 time points, respectively. This preceded radiographic assessments of PR at weeks 6 and 15, respectively.