. 2023 Apr 18;29(12):2310–2323. doi: 10.1158/1078-0432.CCR-22-2242

Figure 5.

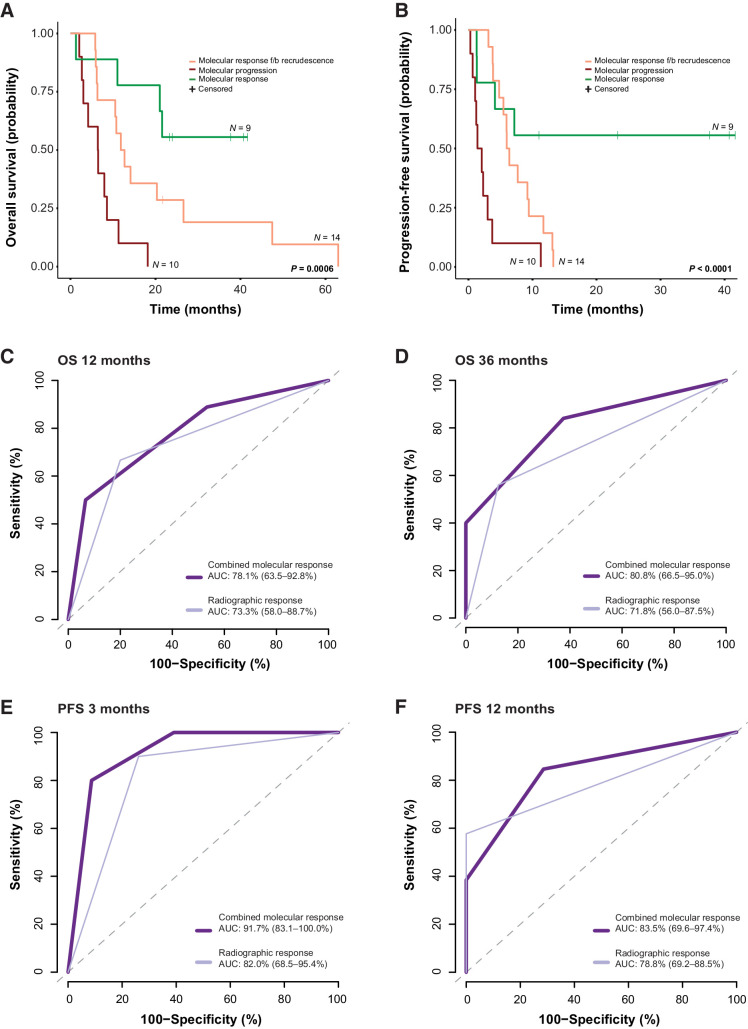
Figure 5. Combined tiered ctDNA molecular responses and the prediction of survival outcomes. Of the 33 patients included in the study cohort, patients who were assigned a classification of molecular response (green) based on longitudinal dynamic changes in cfTL displayed superior (A) overall survival (OS; median survival not reached vs. 12.35 vs. 6.48 months; log-rank P 0.0006) and (B) progression-free survival (PFS; median survival not reached vs. 6.18 vs. 1.74 months; log-rank P < 0.0001) compared with patients with an initial molecular response followed by recrudescence (orange) or molecular progression (red). C and D, Molecular responses derived from ctDNA (dark purple) were a stronger predictor of OS at 12 (AUC 78.1 vs. 73.3) and 36 (AUC 80.0 vs. 71.8) months, and (E and F) early post-therapy PFS at 3 (AUC 91.7 vs. 82.0) and 12 (AUC 83.5 vs. 78.8) months, compared with radiographic assessment (PR/CR vs. SD/PD/MR; light purple). f/b, followed by.

Combined tiered ctDNA molecular responses and the prediction of survival outcomes. Of the 33 patients included in the study cohort, patients who were assigned a classification of molecular response (green) based on longitudinal dynamic changes in cfTL displayed superior (A) overall survival (OS; median survival not reached vs. 12.35 vs. 6.48 months; log-rank P 0.0006) and (B) progression-free survival (PFS; median survival not reached vs. 6.18 vs. 1.74 months; log-rank P < 0.0001) compared with patients with an initial molecular response followed by recrudescence (orange) or molecular progression (red). C and D, Molecular responses derived from ctDNA (dark purple) were a stronger predictor of OS at 12 (AUC 78.1 vs. 73.3) and 36 (AUC 80.0 vs. 71.8) months, and (E and F) early post-therapy PFS at 3 (AUC 91.7 vs. 82.0) and 12 (AUC 83.5 vs. 78.8) months, compared with radiographic assessment (PR/CR vs. SD/PD/MR; light purple). f/b, followed by.