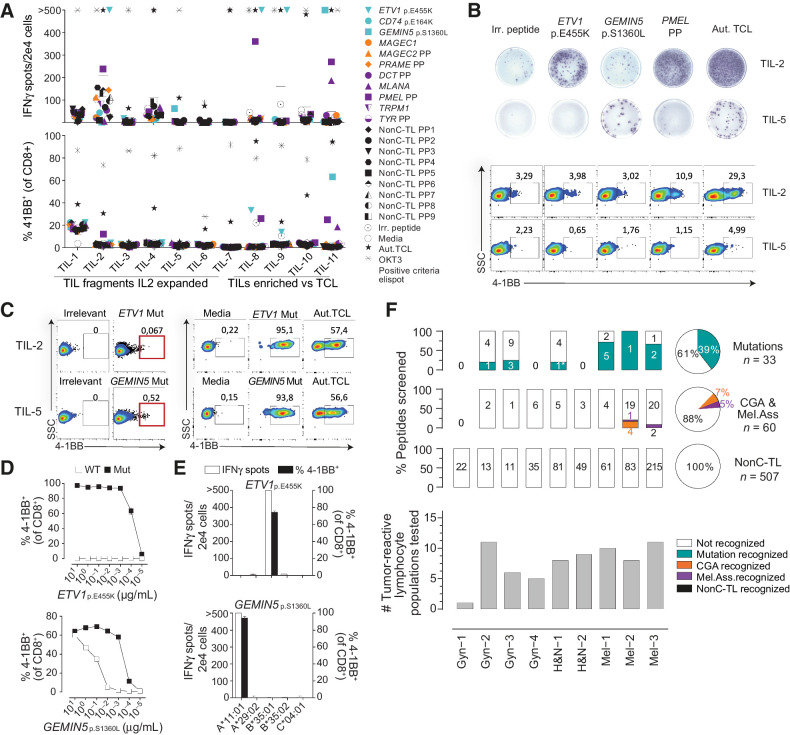
Figure 3.
Preexisting T-cell responses to candidate tumor antigens in patients with cancer. For each patient, reactivity was evaluated by co-incubating 2e4 T cells (TIL or PBL sorted on the basis of specific markers, e.g., PD1hi), with 2e5 autologous APC pulsed with 1 μg/mL of selected peptides either alone or in pools (PP). IFNγ ELISPOT and 4–1BB upregulation by FACS were used to measure T-cell responses after 20 hours. A, Reactivity to tumor antigen candidates for Mel-3. The number of IFNγ spots per well (top) and the percentage of cells expressing 4–1BB (bottom) are shown. Mutated peptides are plotted in turquoise, CGA in orange, melanoma-associated in purple, and nonC-TL in black. B, Representative ELISPOT results (top) and flow cytometry plots (bottom) for TIL-2 and TIL-5 from Mel-3 with the targets specified. C, TIL populations recognizing the mutated HLA-I peptides indicated were enriched by flow cytometry sorting of 4–1BB+ lymphocytes and expanded for 14 days. Plot showing gates used for sorting (left) and recognition of the targets specified after expansion (right). D, T-cell reactivity of neoantigen-enriched T-cell populations to serial dilutions of the WT or mutant (Mut) ETV1p.E455K and GEMIN5p.S1360L peptides. E, Neoantigen-enriched population was cocultured with COS-7 cells transfected with the indicated individual HLA-I alleles and pulsed with the corresponding peptides to determine the restriction element. F, Summary of the reactivity against candidate tumor antigens in all patients studied. The percentage and the absolute number of recognized and non-recognized peptides within each category are shown per patient (bar plot) and for all the patients studied (pie chart). The number of tumor-reactive lymphocytes tested for each patient is shown on the bottom. Plotted cells were gated on live CD3+CD8+lymphocytes. ‘>’ denotes greater than 500 spots/2e4 cells. *Mutation recognized previously identified. Experiments were performed twice. Aut.TCL: autologous tumor cell line.

