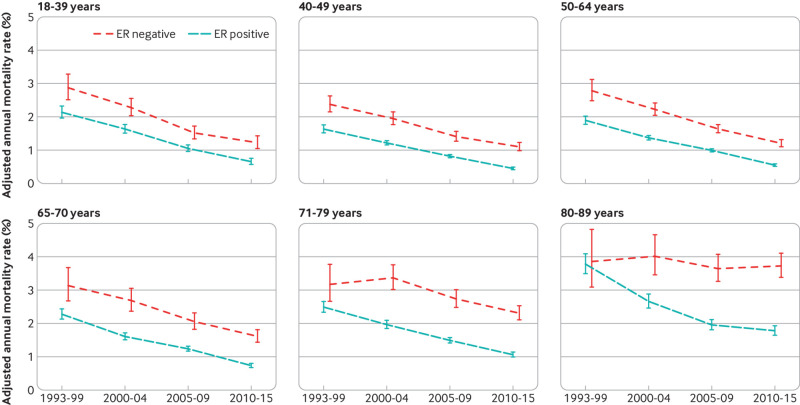
Fig 3.
Adjusted annual breast cancer mortality rates in 512 447 women with early breast cancer with oestrogen receptor (ER) positive or ER negative disease by calendar period of diagnosis, according to age at diagnosis. Rates are adjusted for whether cancer was screen detected, tumour size, number of positive nodes, tumour grade, time since diagnosis, breast cancer laterality, index of multiple deprivation, and region of residence. Vertical lines are 95% confidence intervals. Further details are in figure S13. Results including only five years of follow-up (so that all age groups have the same length of follow-up) are in figure S11. Results for breast cancer laterality, index of multiple deprivation and region of residence are in figure S12. Results for all cause mortality are in figures S29 and S30

