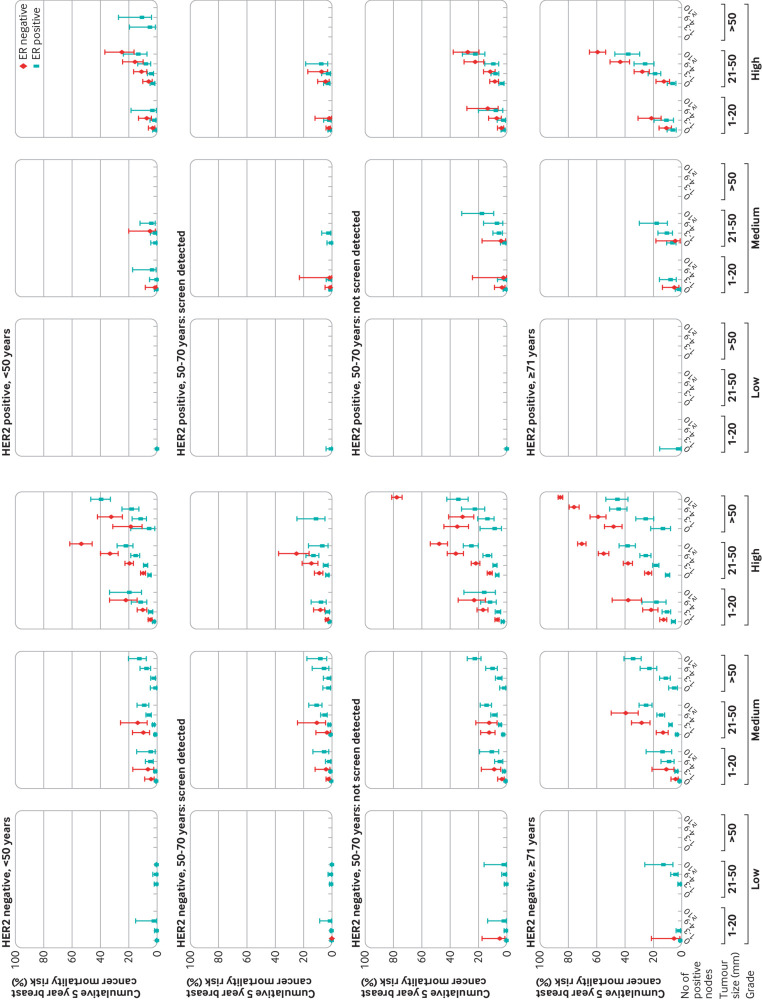
Fig 8.
Cumulative five year breast cancer mortality risks in 156 338 women with early breast cancer diagnosed during 2010-15 by categories of tumour grade, tumour size and number of positive nodes in women with oestrogen receptor (ER) positive or ER negative disease. Figures are split by human epidermal growth factor receptor 2 (HER2) status, age and screening status. Vertical lines are 95% confidence intervals. Points are plotted for groups of women with data on ≥40 women and include 153 006/156 338 (97.9%) of women. Further details, including values of plotted points, are given in tables S9 and S10. Results on a square root scale are in figure S22. Results for all cause mortality are in figure S31

