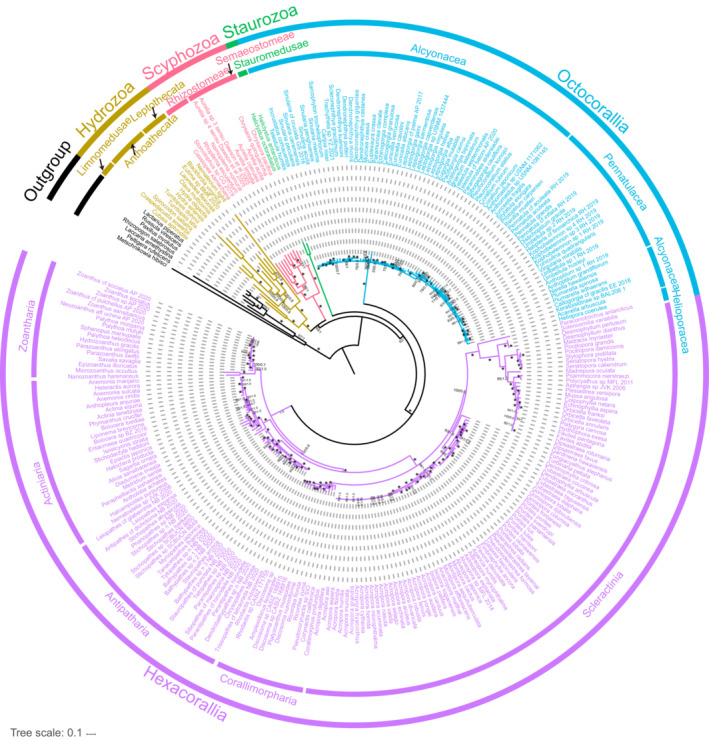
FIGURE 6.

The phylogenetic tree of Cnidaria derived from Bayesian inference and Maximum Likelihood analyses using 13 PCGs. The numbers at each node are bootstrap values (BS) for ML and Bayesian posterior probability (BPP) for BI. Stars denote maximum support values.
