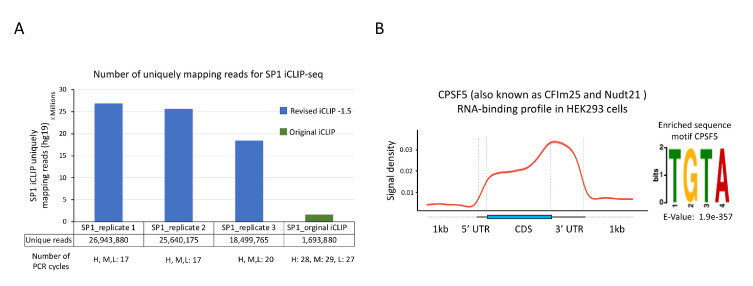
Figure 5. Sample results for iCLIP-seq data analysis.
A. Comparison of number of uniquely mapping reads for SP1 iCLIP-seq data generated using either the revised protocol (reported here) or the original protocol. iCLIP-seq data for SP1 replicates 1–3 was reported as SP1.S2, SP1.S3, and SP1-E, respectively, in Song et al. (2022) (GSE165739). B. Left: Standardized metaplot profile showing the signal for CPSF5 along mRNA transcripts. iCLIP-seq was performed using GFP-tagged CPSF5 as reported in Song et al. (2022). Raw iCLIP data was acquired from the GEO database using the accession number GSE165739. Crosslink-induced truncation sites were identified using the CTK package (FDR ≤ 0.01). Right: Top RNA-binding motif identified in CPSF5 iCLIP-seq. MEME software was used for de novo motif discovery. U in the target RNA sequences was replaced by T for MEME analysis. Statistical significance was calculated against randomly assorted sequences.

