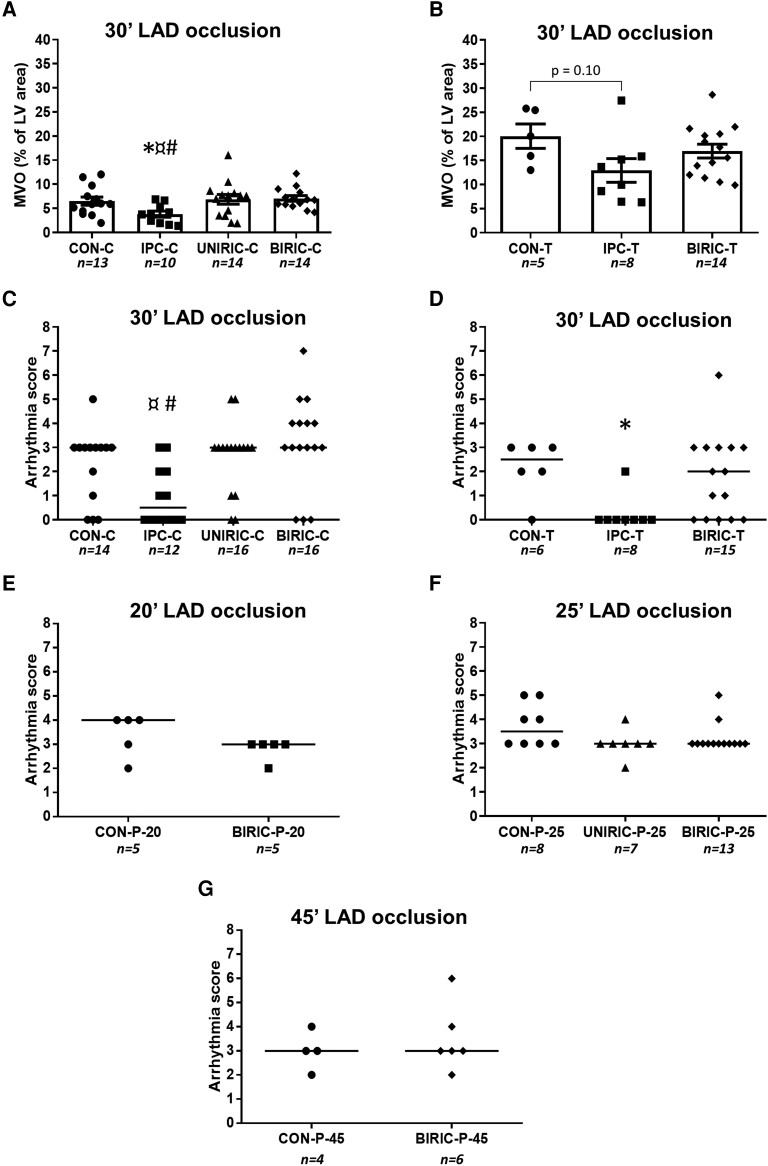
Figure 4.
MVO and arrhythmia scores. In the case of MVO, results are presented as mean ± SEM; in the case of arrhythmia scores, results are presented as median. (A) MVO at the study centre of Budapest—one-way ANOVA and uncorrected Fisher’s LSD post hoc test. (B) MVO at the study centre of Szeged—one-way ANOVA, uncorrected Fisher’s LSD post hoc test, *P < 0.05 vs. CON, ¤P < 0.05 vs. UNIRIC, #P < 0.05 vs. BIRIC. (C) Arrhythmia scores at the study centre of Budapest—the Kruskal–Wallis test, multiple comparisons, and Dunn’s post hoc test. (D) Arrhythmia scores at the study centre of Szeged—the Kruskal–Wallis test, multiple comparisons, and Dunn’s post hoc test. (E–G) Arrhythmia scores at the study centre of Amsterdam with various durations of myocardial ischaemia. In cases of E and G, the Mann–Whitney test; in the case of F, the Kruskal–Wallis test, multiple comparisons, and Dunn’s post hoc test. MVO: microvascular obstruction; LV: left ventricle; LAD: left anterior descending coronary artery; CON: control; IPC: ischaemic preconditioning; UNIRIC: unilateral RIC; BIRIC: bilateral RIC; RIC: remote ischaemic conditioning. Group sizes (n) as the number of animals are shown under the corresponding groups.

