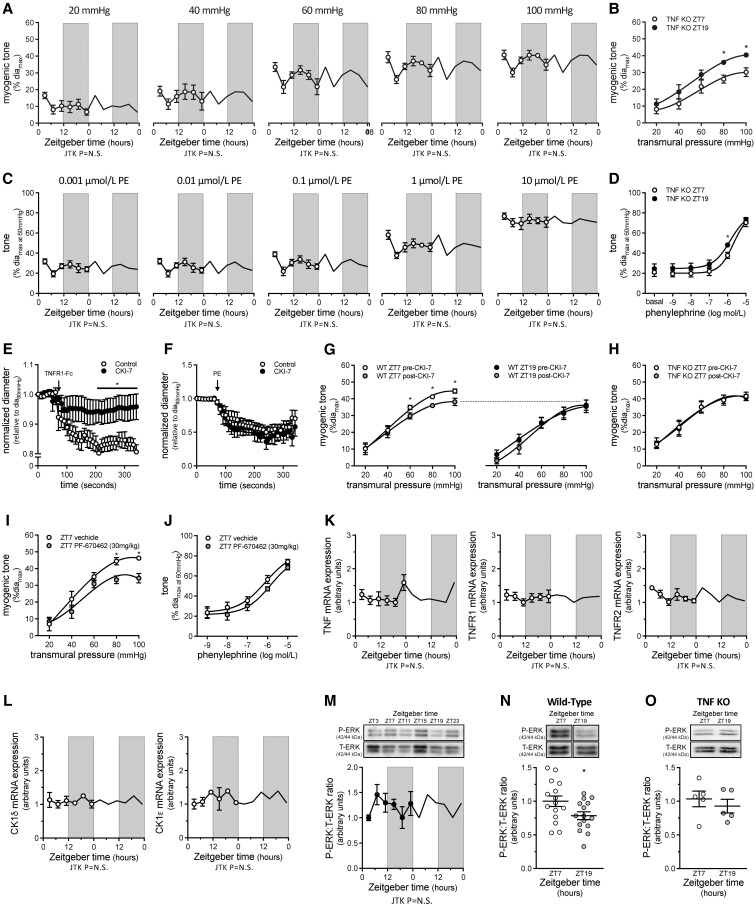
Figure 2.
Rhythmic myogenic reactivity depends on TNF reverse signalling. (A) Myogenic tone in tumour necrosis factor knockout (TNF KO) cremaster arteries plotted over Zeitgeber time (n = 5–6) and (B) at ZT7 and ZT19 (n = 5–6). (C) Phenylephrine (PE)-stimulated vasoconstriction in TNF KO cremaster arteries plotted over Zeitgeber time (n = 5–6) and (D) at ZT7 and ZT19 (n = 5–6). (E–G) Effect of in vitro CK1 inhibition (10 nmol/L CKI-7, 30 min) on (E) sTNFR1-Fc stimulated vasoconstriction (n = 4–5), (F) phenylephrine-stimulated vasoconstriction (n = 5) and (G) myogenic tone at ZT7 (n = 6) and ZT19 (n = 5) in wild-type cremaster arteries. (H) Effect of in vitro CK1 inhibition on myogenic tone in TNF KO cremaster arteries at ZT7 (n = 5). (I–J) Effect of in vivo CK1 inhibition (30 mg/kg PF670462 i.p.; 24 h) on cremaster artery (I) myogenic tone and (J) phenylephrine-stimulated vasoconstriction (both n = 5; both at ZT7). (K) TNF, TNFR1, and TNFR2 mRNA expression (normalized to HMBS mRNA expression) in cremaster arteries plotted over Zeitgeber time (n = 5–7 for each point). (L) CK1 delta and CK1 epsilon mRNA expression (normalized to HMBS mRNA expression) in cremaster arteries plotted over Zeitgeber time (n = 2 for each point). (M) pressure-stimulated (40–100 mmHg) ERK1/2 phosphorylation levels in wild-type cremaster arteries plotted over Zeitgeber time (n = 5). (N and O) ERK1/2 phosphorylation levels at ZT7 and ZT19 in (N) wild-type (n = 15) and (O) TNF KO cremaster arteries (n = 5). Data in Panels A, C, K, L, and M are double-plotted for visualization purposes and are statistically analysed for a circadian rhythm with JTK_Cycle. Panels B, D, E, F, I, and J are statistically analysed as unpaired single comparisons using t-tests or Mann–Whitney tests, with * denoting P < 0.05. Panels G, H, N, and O are statistically analysed as paired single comparisons using paired t-tests or Wilcoxon tests, with * denoting P < 0.05.

